Understanding the INVISION View Fields Page
Guide to Understanding View Fields
The View Fields page of INVISION is designed to offer users an in depth and intuitive view of a specific grower's field and trial progress. This document will guide you through the key components of View Fields, helping you navigate and utilize the platform effectively for optimal trial management.
Components of View Fields
- Trial Panel
- Location: Left side of View Fields.
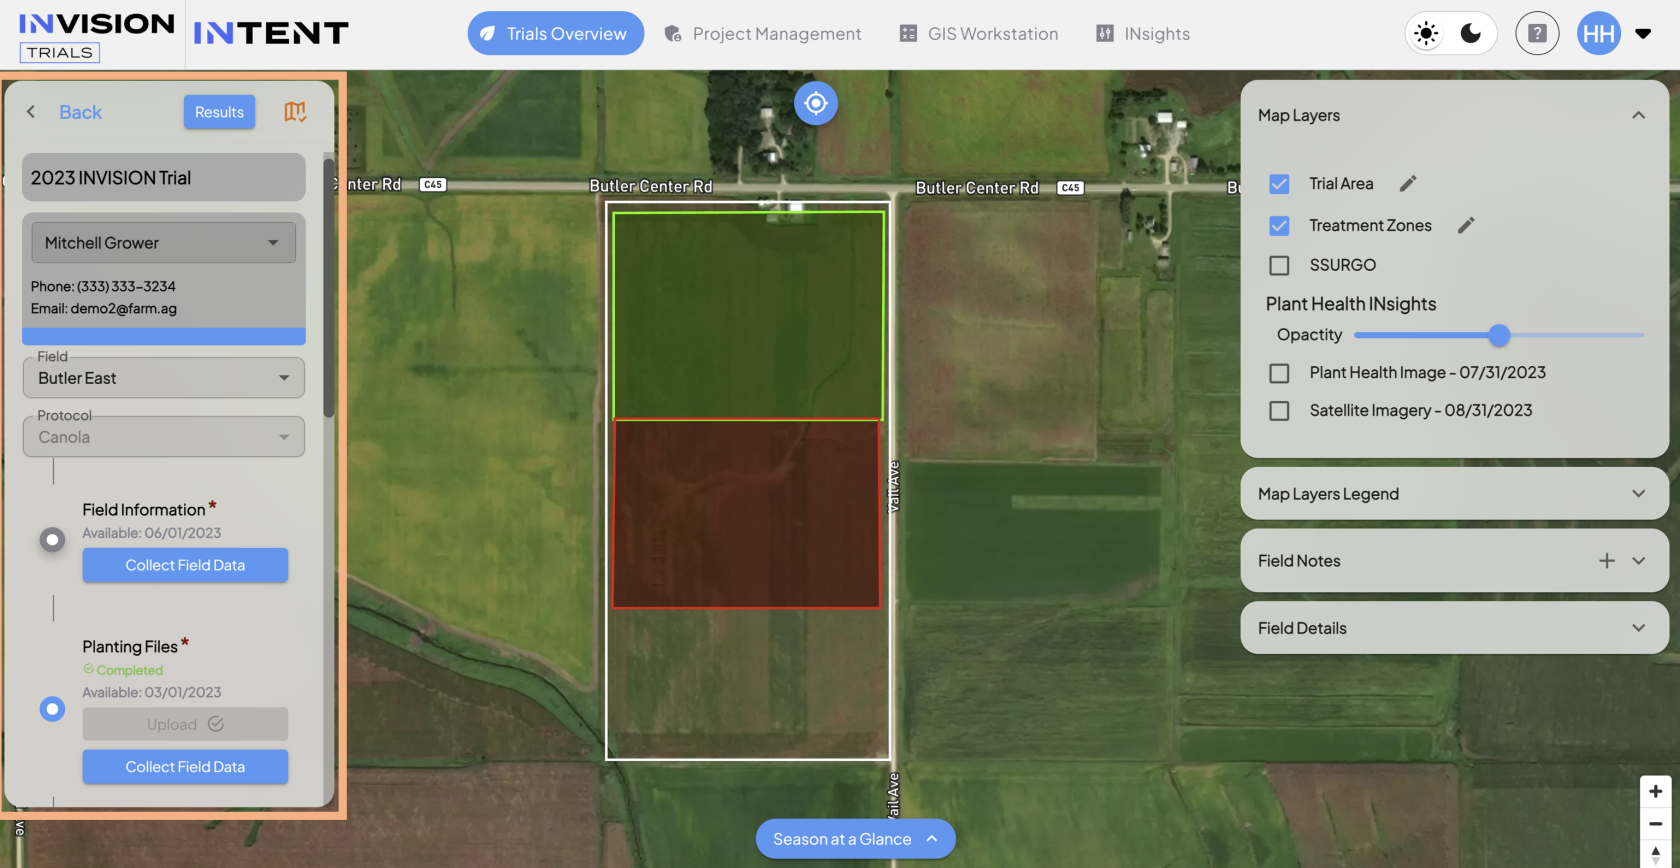
- Function: The Trial Panel is like the control center of View Fields. This is where users can select or change the field and/or protocol that they're viewing on the map, and it gives access to act on the protocol steps of the trial.
- Trial: Displays the Trial of the Field the user is viewing.
- Grower Selection: Displays the owner of the field the user is currently viewing on the map. Users can use the dropdown to cycle through other Growers within the same trial to view in View Fields, without having to go back to the Overview Page.
- Protocol Selection: Displays the protocol of the field the user is currently viewing. Users can use the dropdown to select other protocols that the current field may also be enrolled in to display on View Fields.
- Protocol Steps: All steps of a protocol are represented on the right side of View Fields. Protocol steps will have one or more actionable buttons listed below them.
- Mandatory protocol steps are distinguished with an asterisk.
- Protocol steps are displayed in the order
- Results Button: Opens a PDF that summarizes the statistics and results for the specific field the user is viewing.
- Approve/Disapprove Icon: For users that have access, this button controls the approval/disapproval to publish the harvest analytics for the specific field the user is viewing.

- Location: Left side of View Fields.
- Map Component:
- Location: Central Section of View Fields.
- Function: Offers a dynamic map view of a specific grower's field.
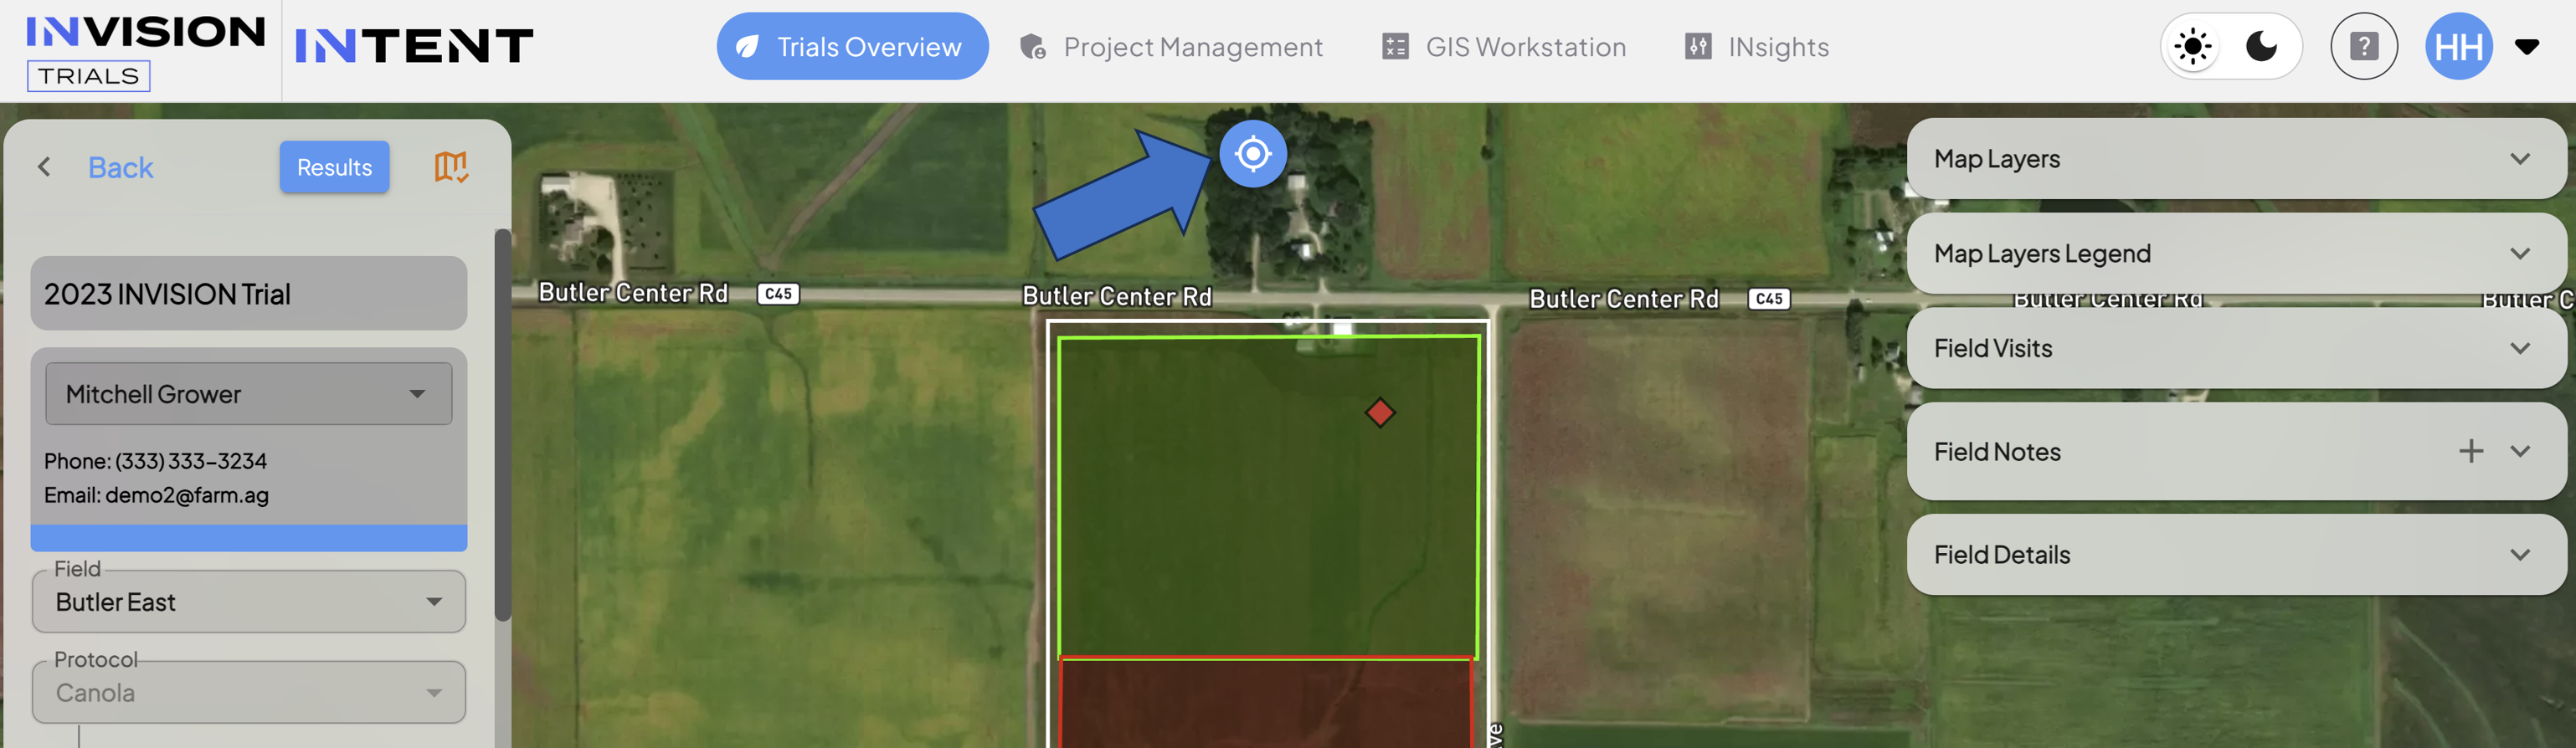
- Center Button: Pans the map so that the field is centered.

- Zoom Level Controls: Users can zoom the map in and out with a mouse or trackpad, but plus and minus buttons are also available to control the zoom level of the map.

- Center Button: Pans the map so that the field is centered.
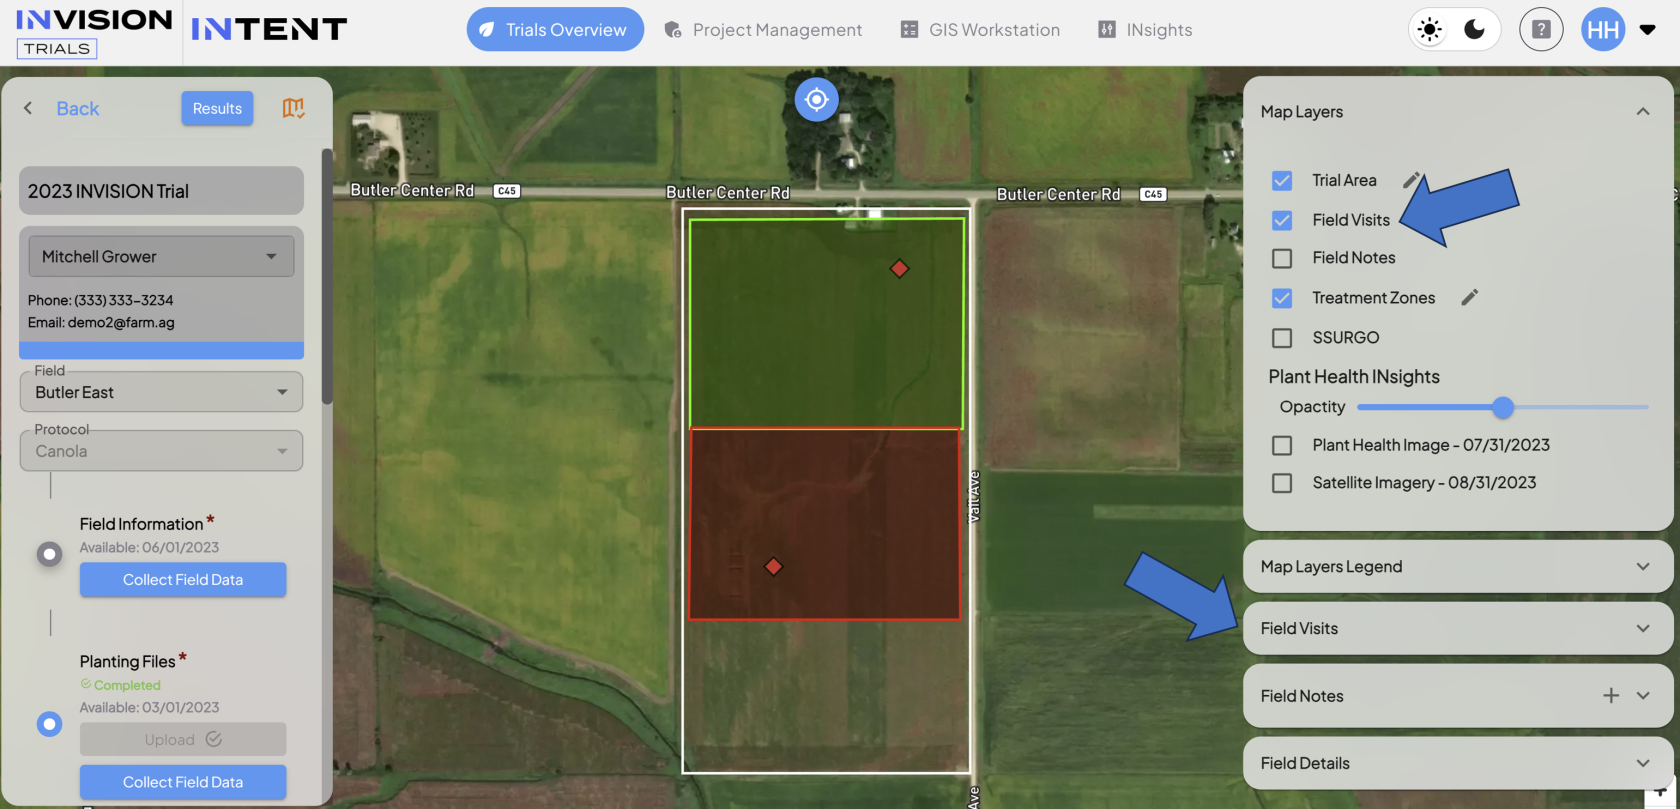
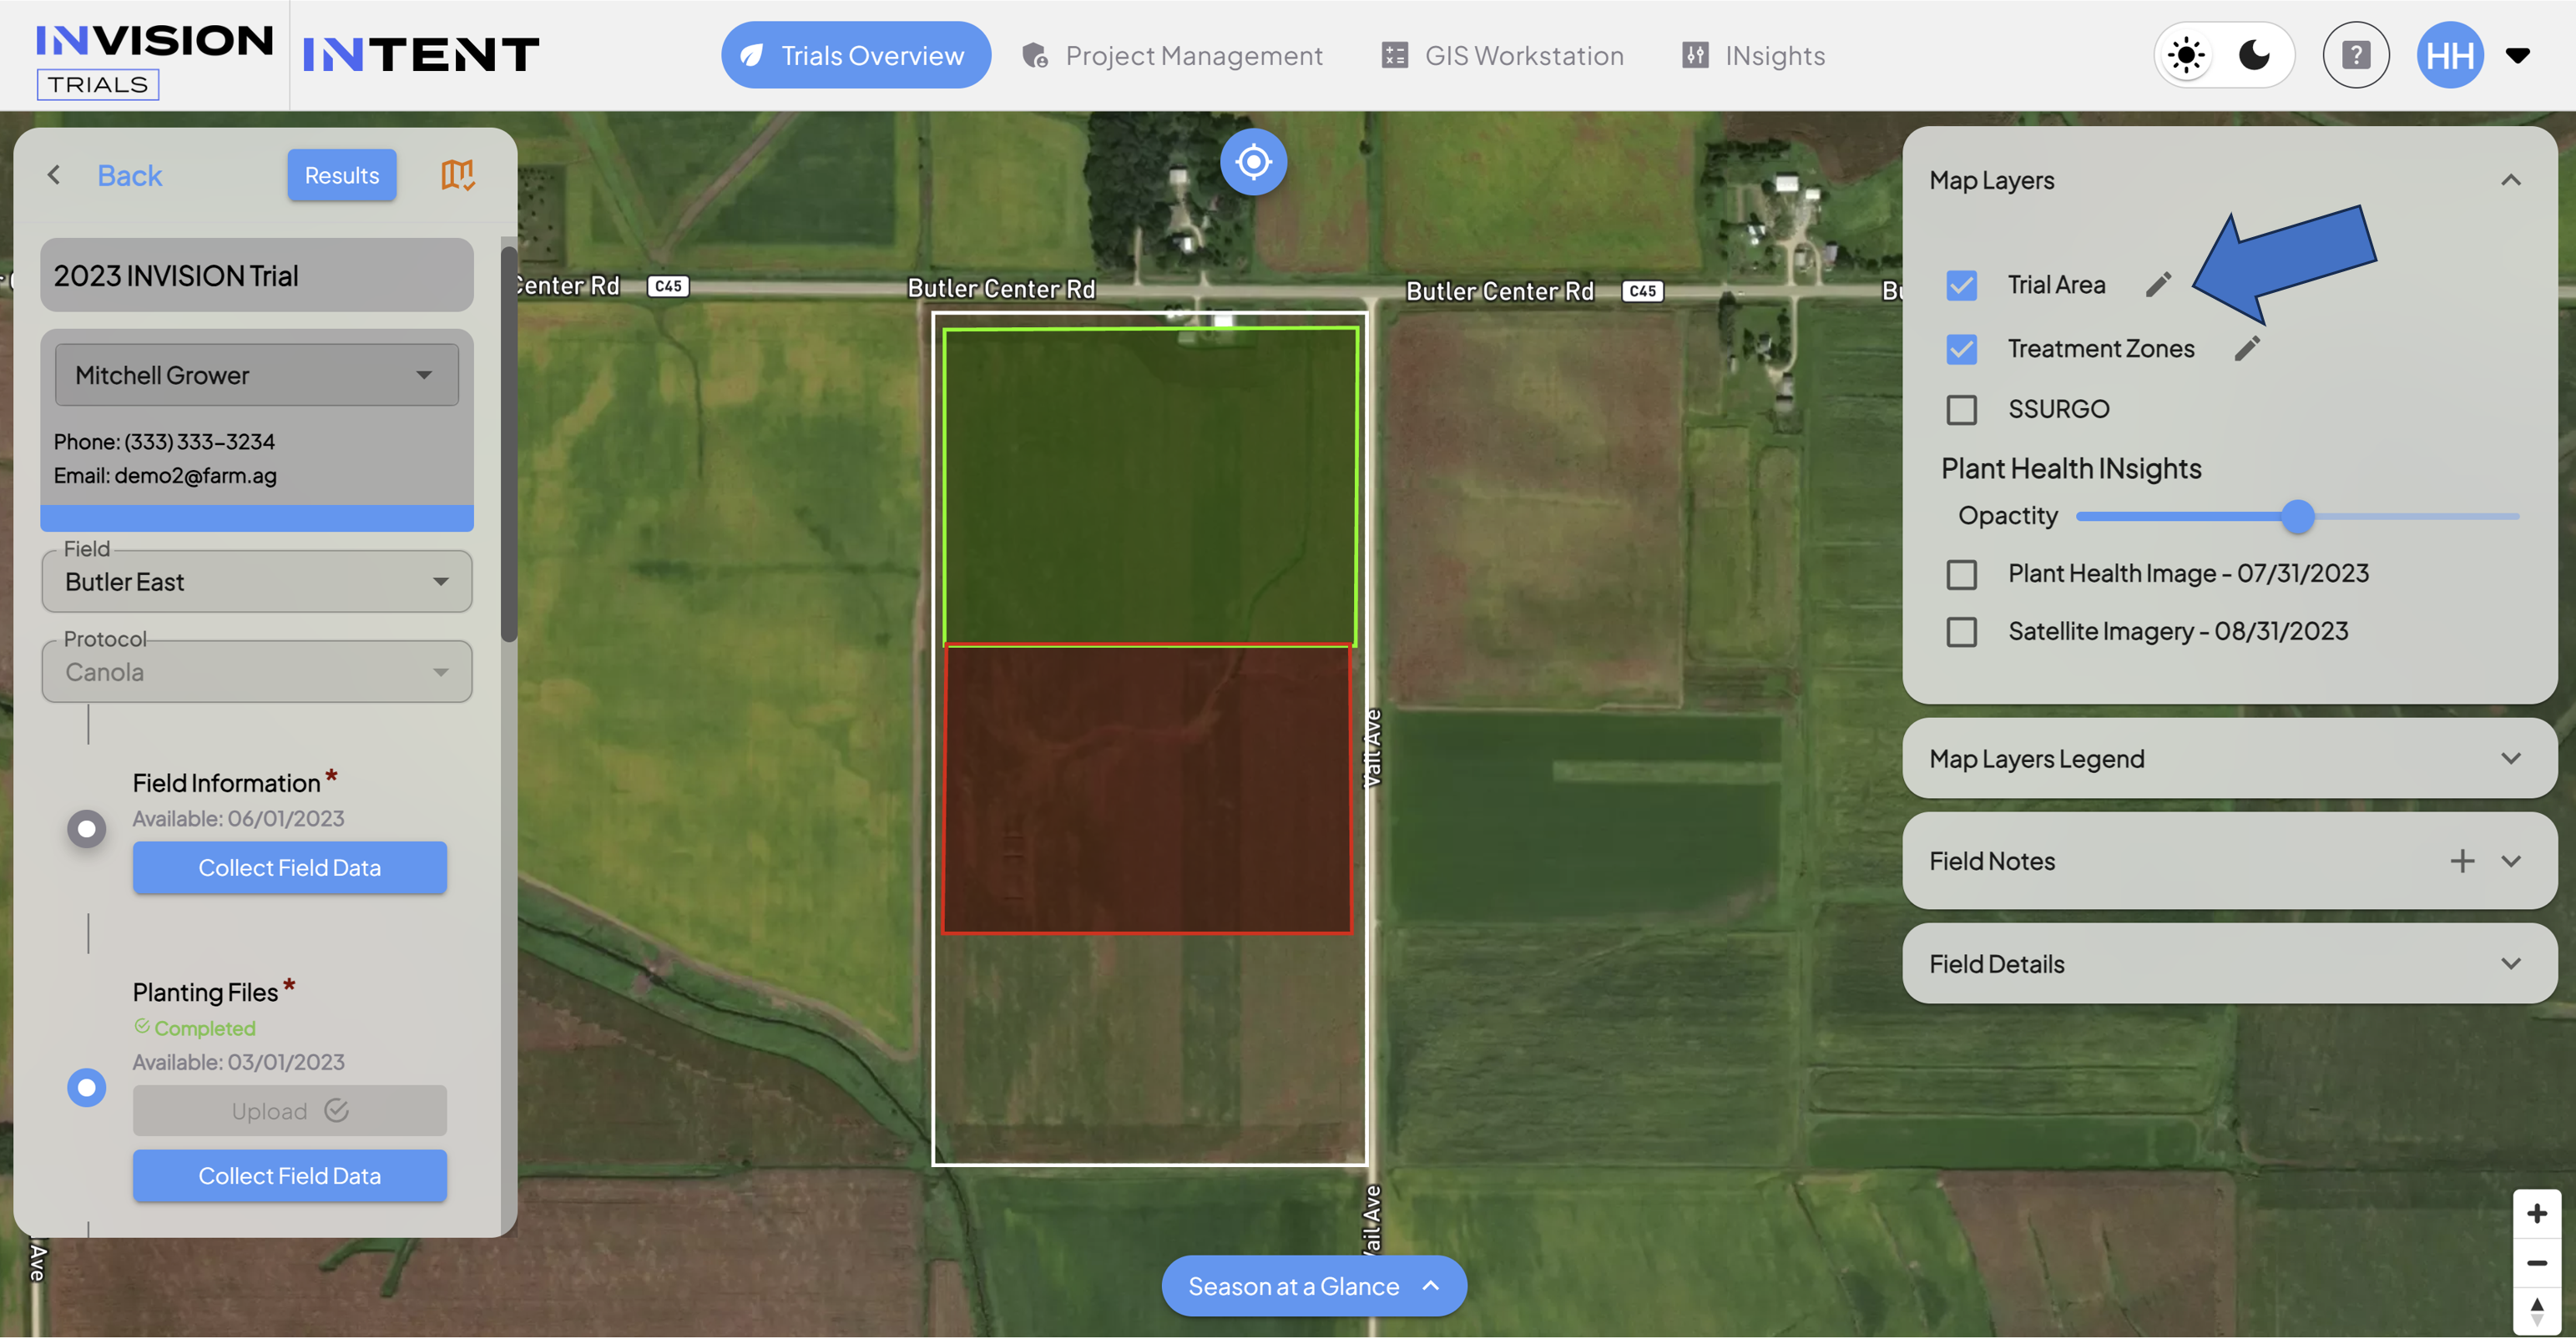
- Map Layers:
- Location: Right side of View Fields.
- Function: Gives the user the ability to toggle the display of different map layers on or off. The following are examples of layers you might see in View Fields:
- Trial Area: Users with specific permissions can edit their field boundary for a specific protocol, and the resulting layer is the Trial Area. This is useful if unforeseen circumstances have an impact on the field, for example, flooding in a particular area of the field prevents the application of a product. In that case, the area of the field that is still active in the trial can be outline with the Trial Area.

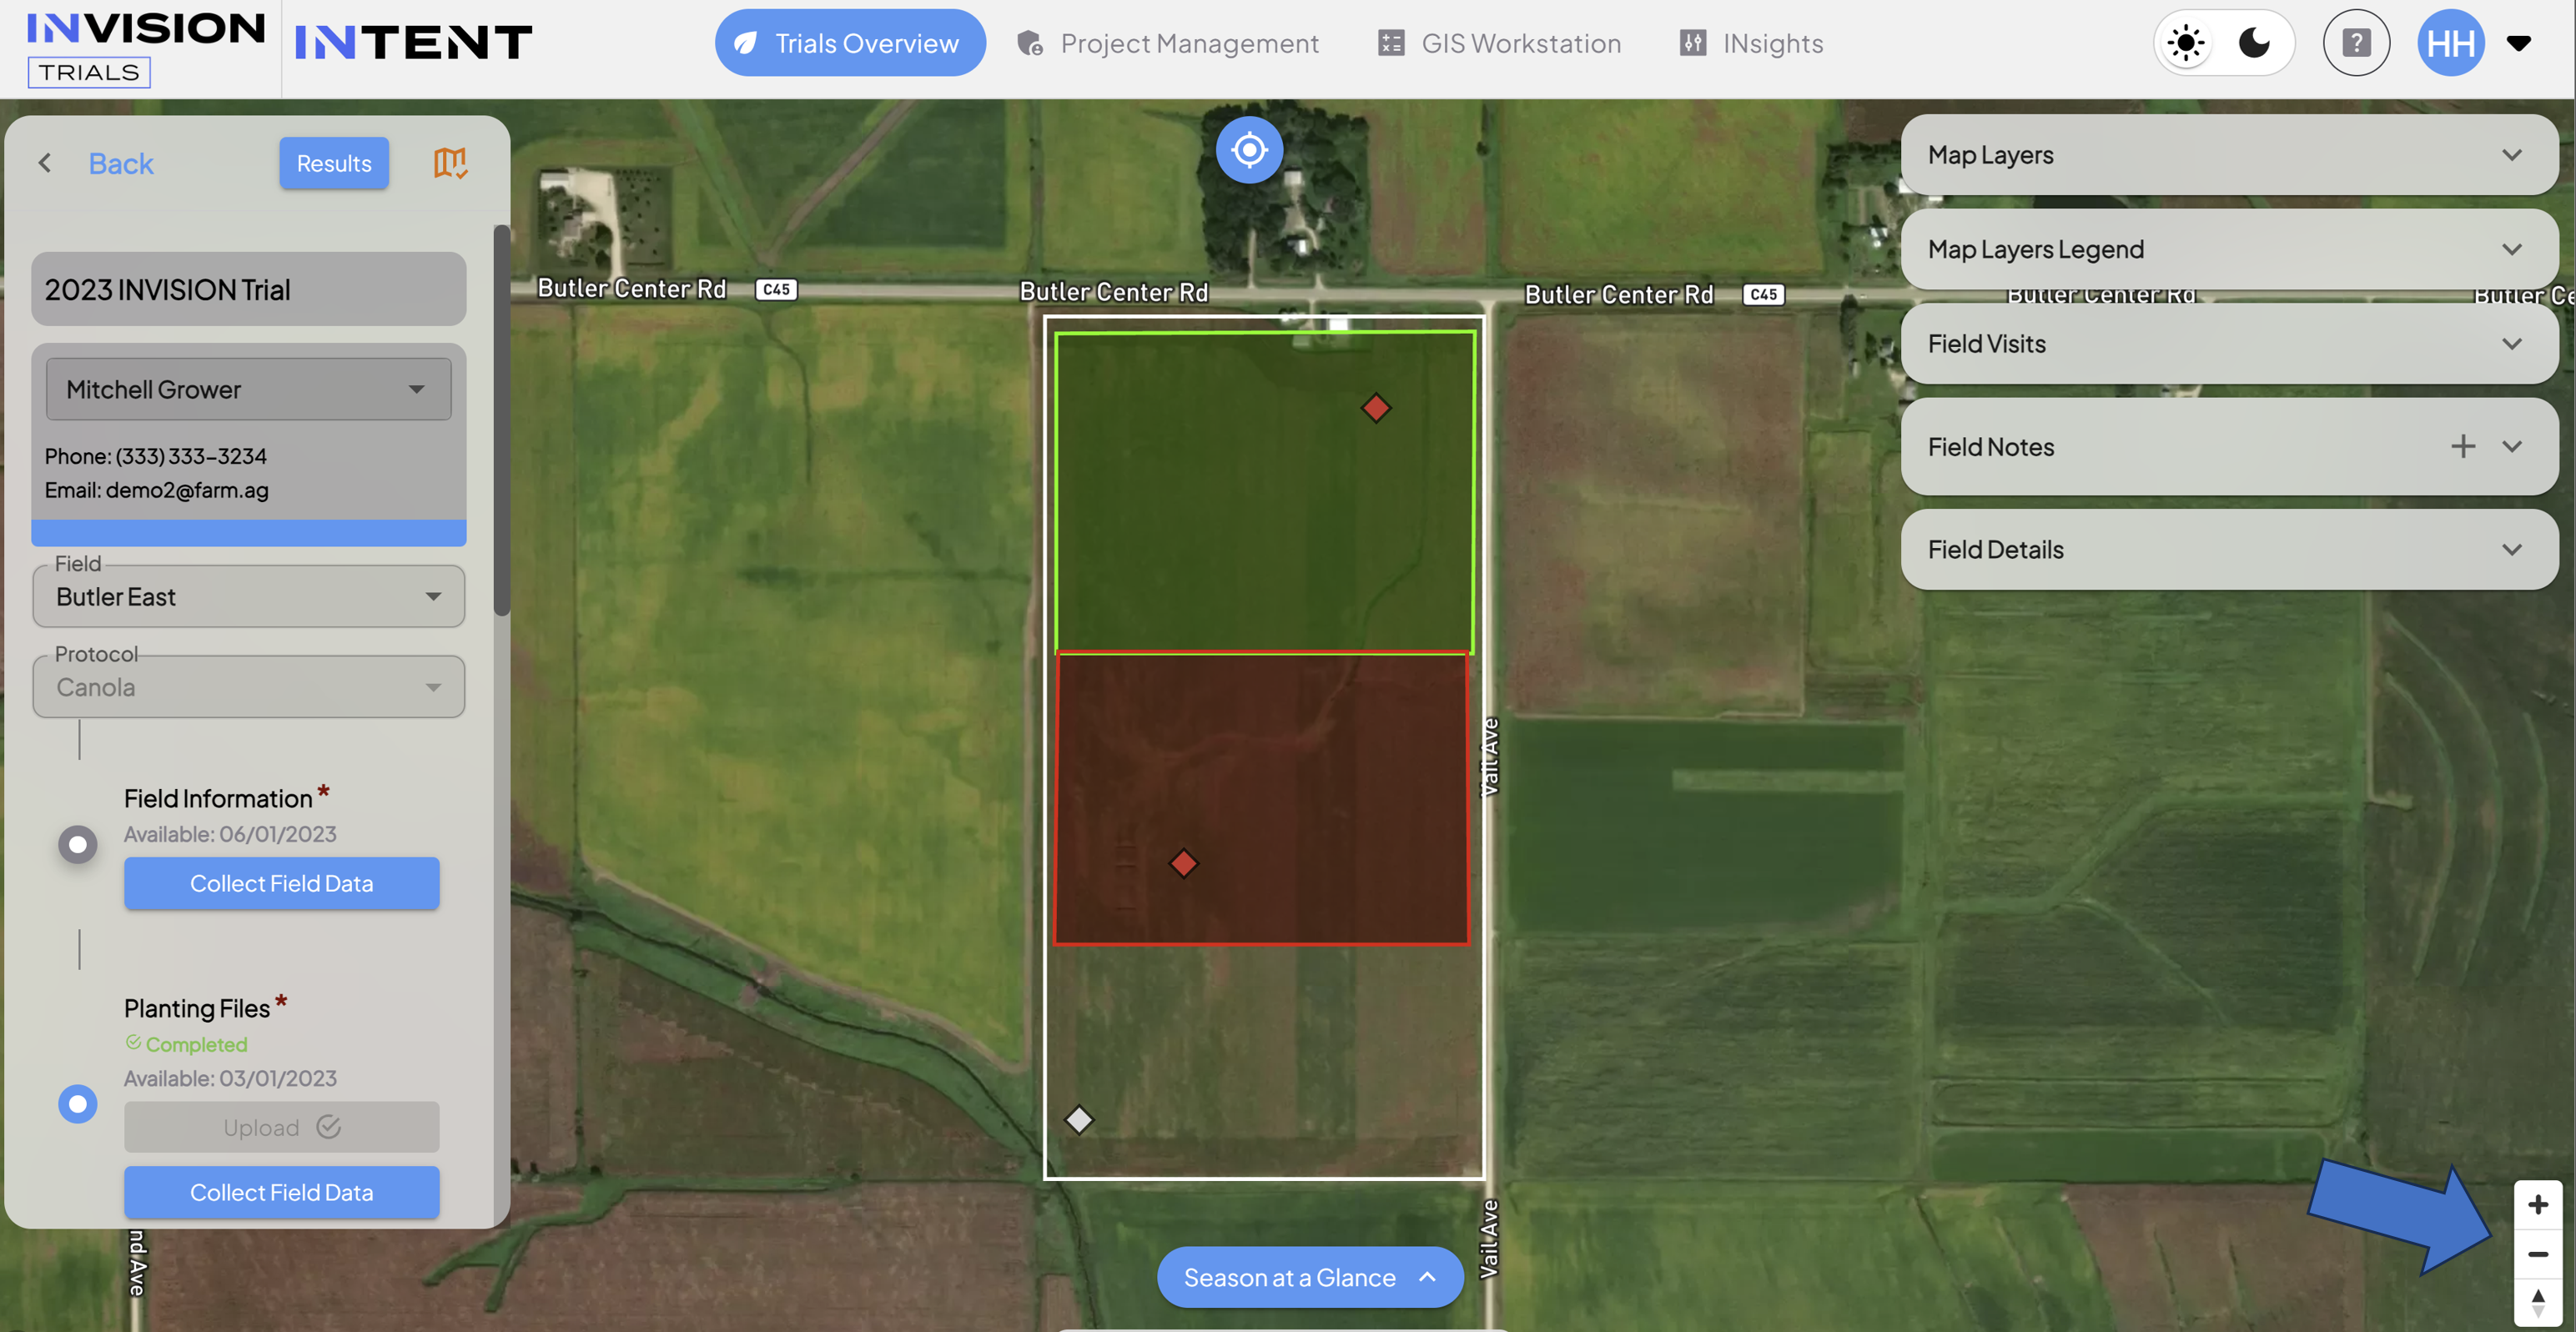
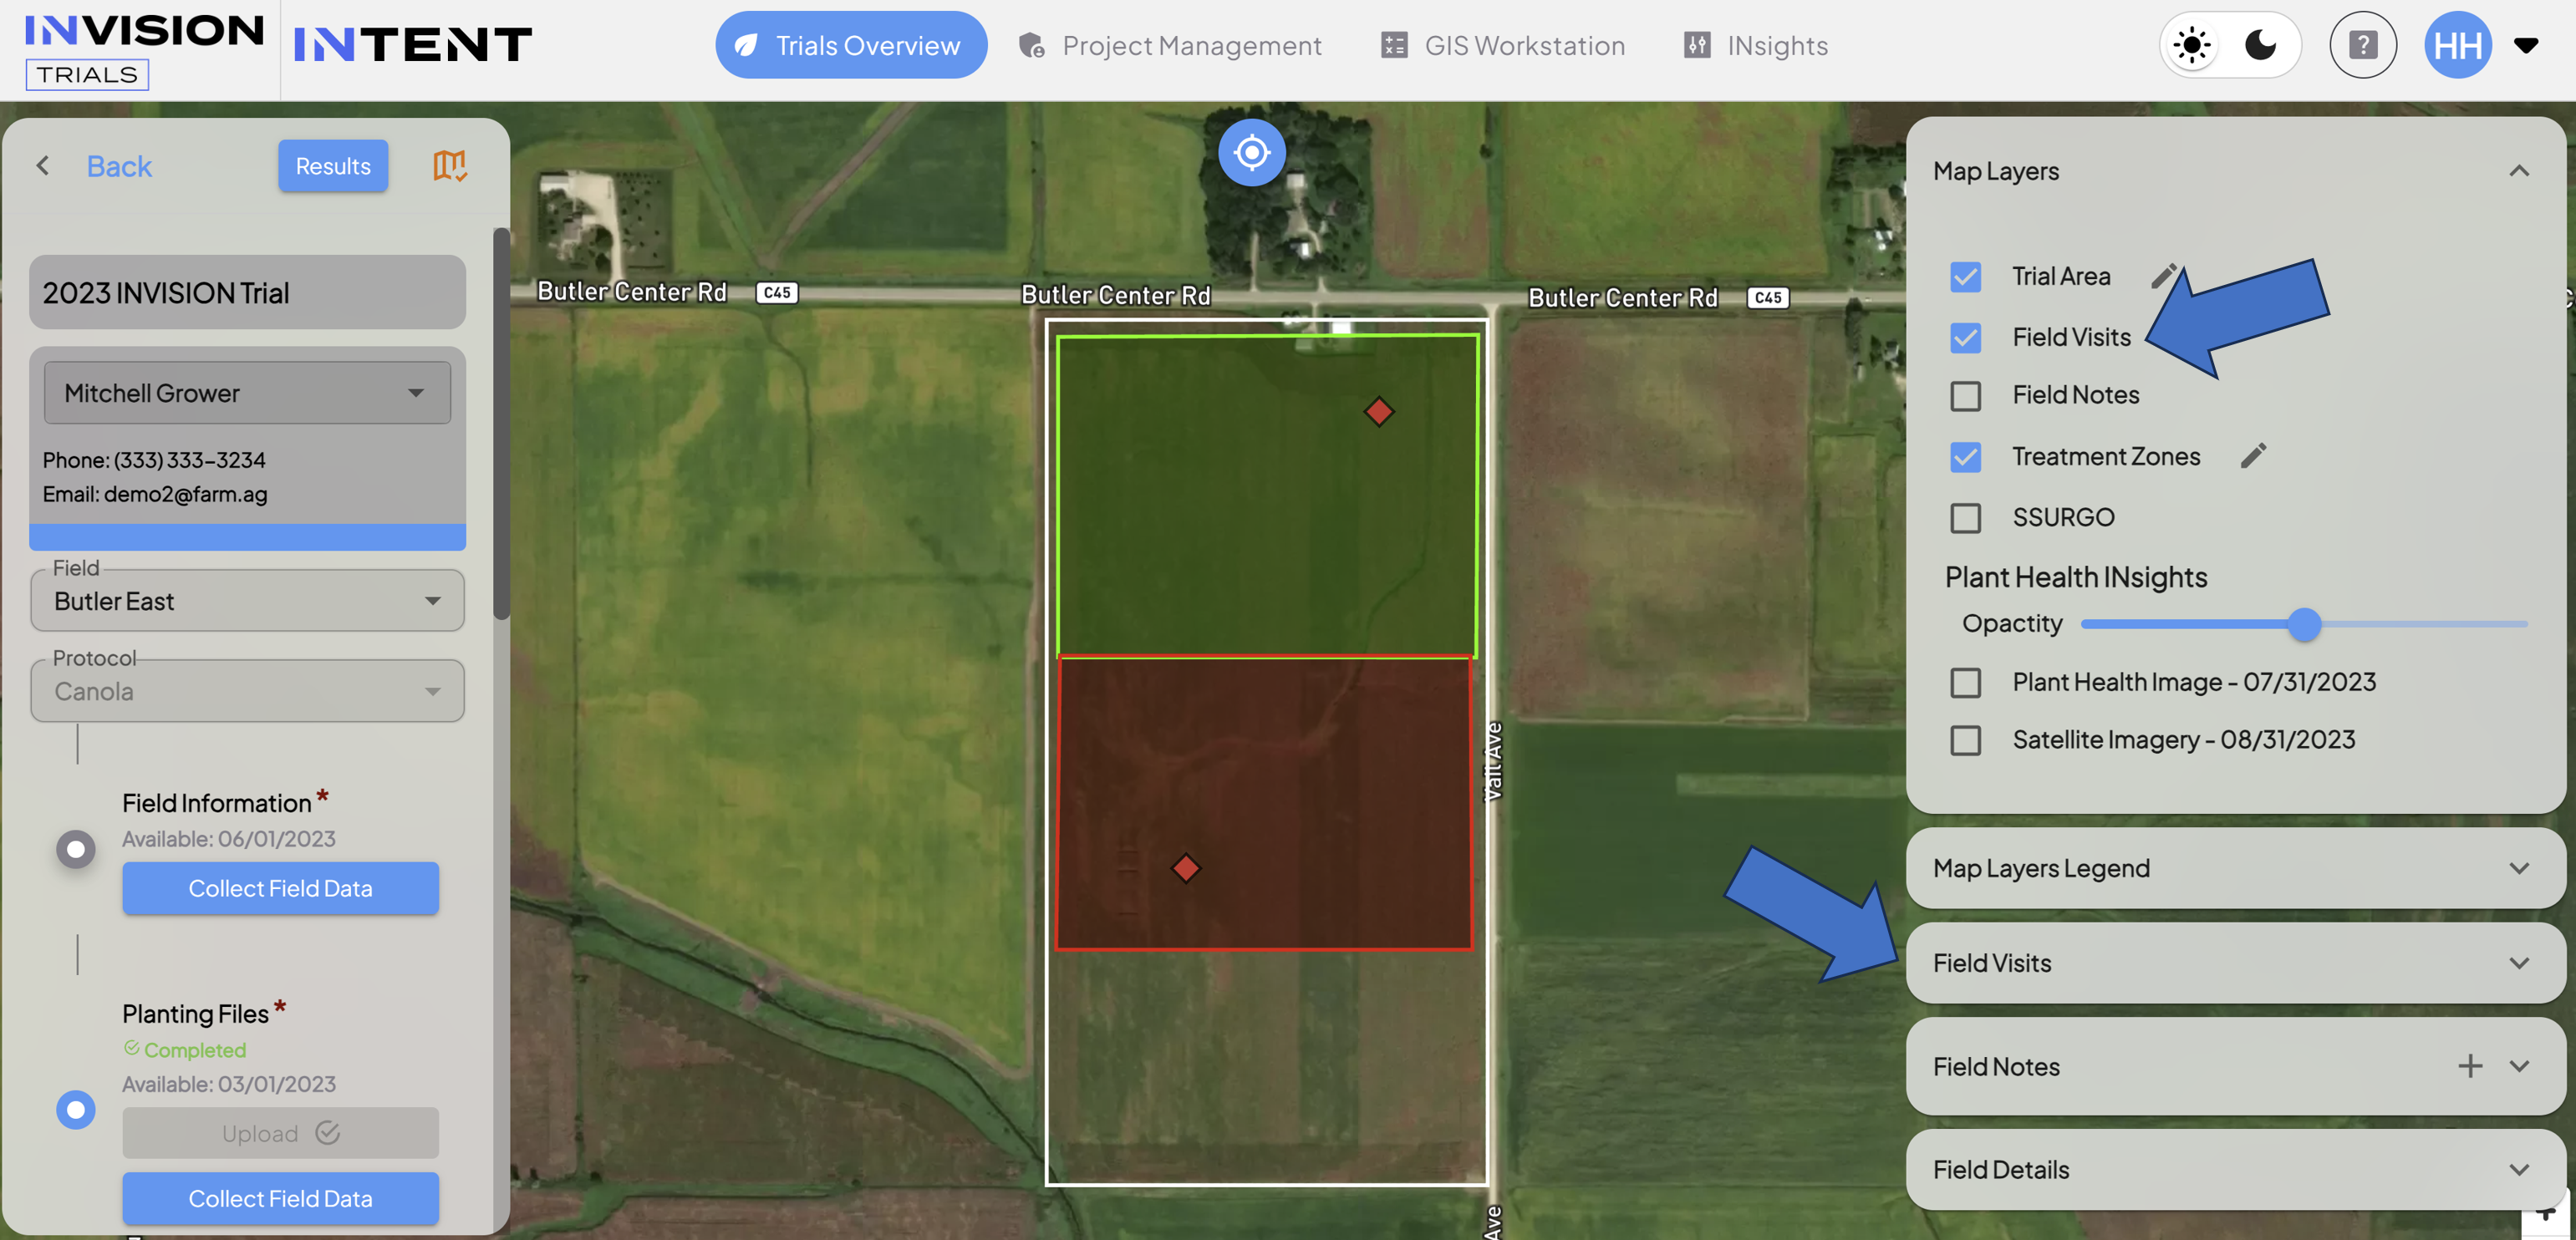
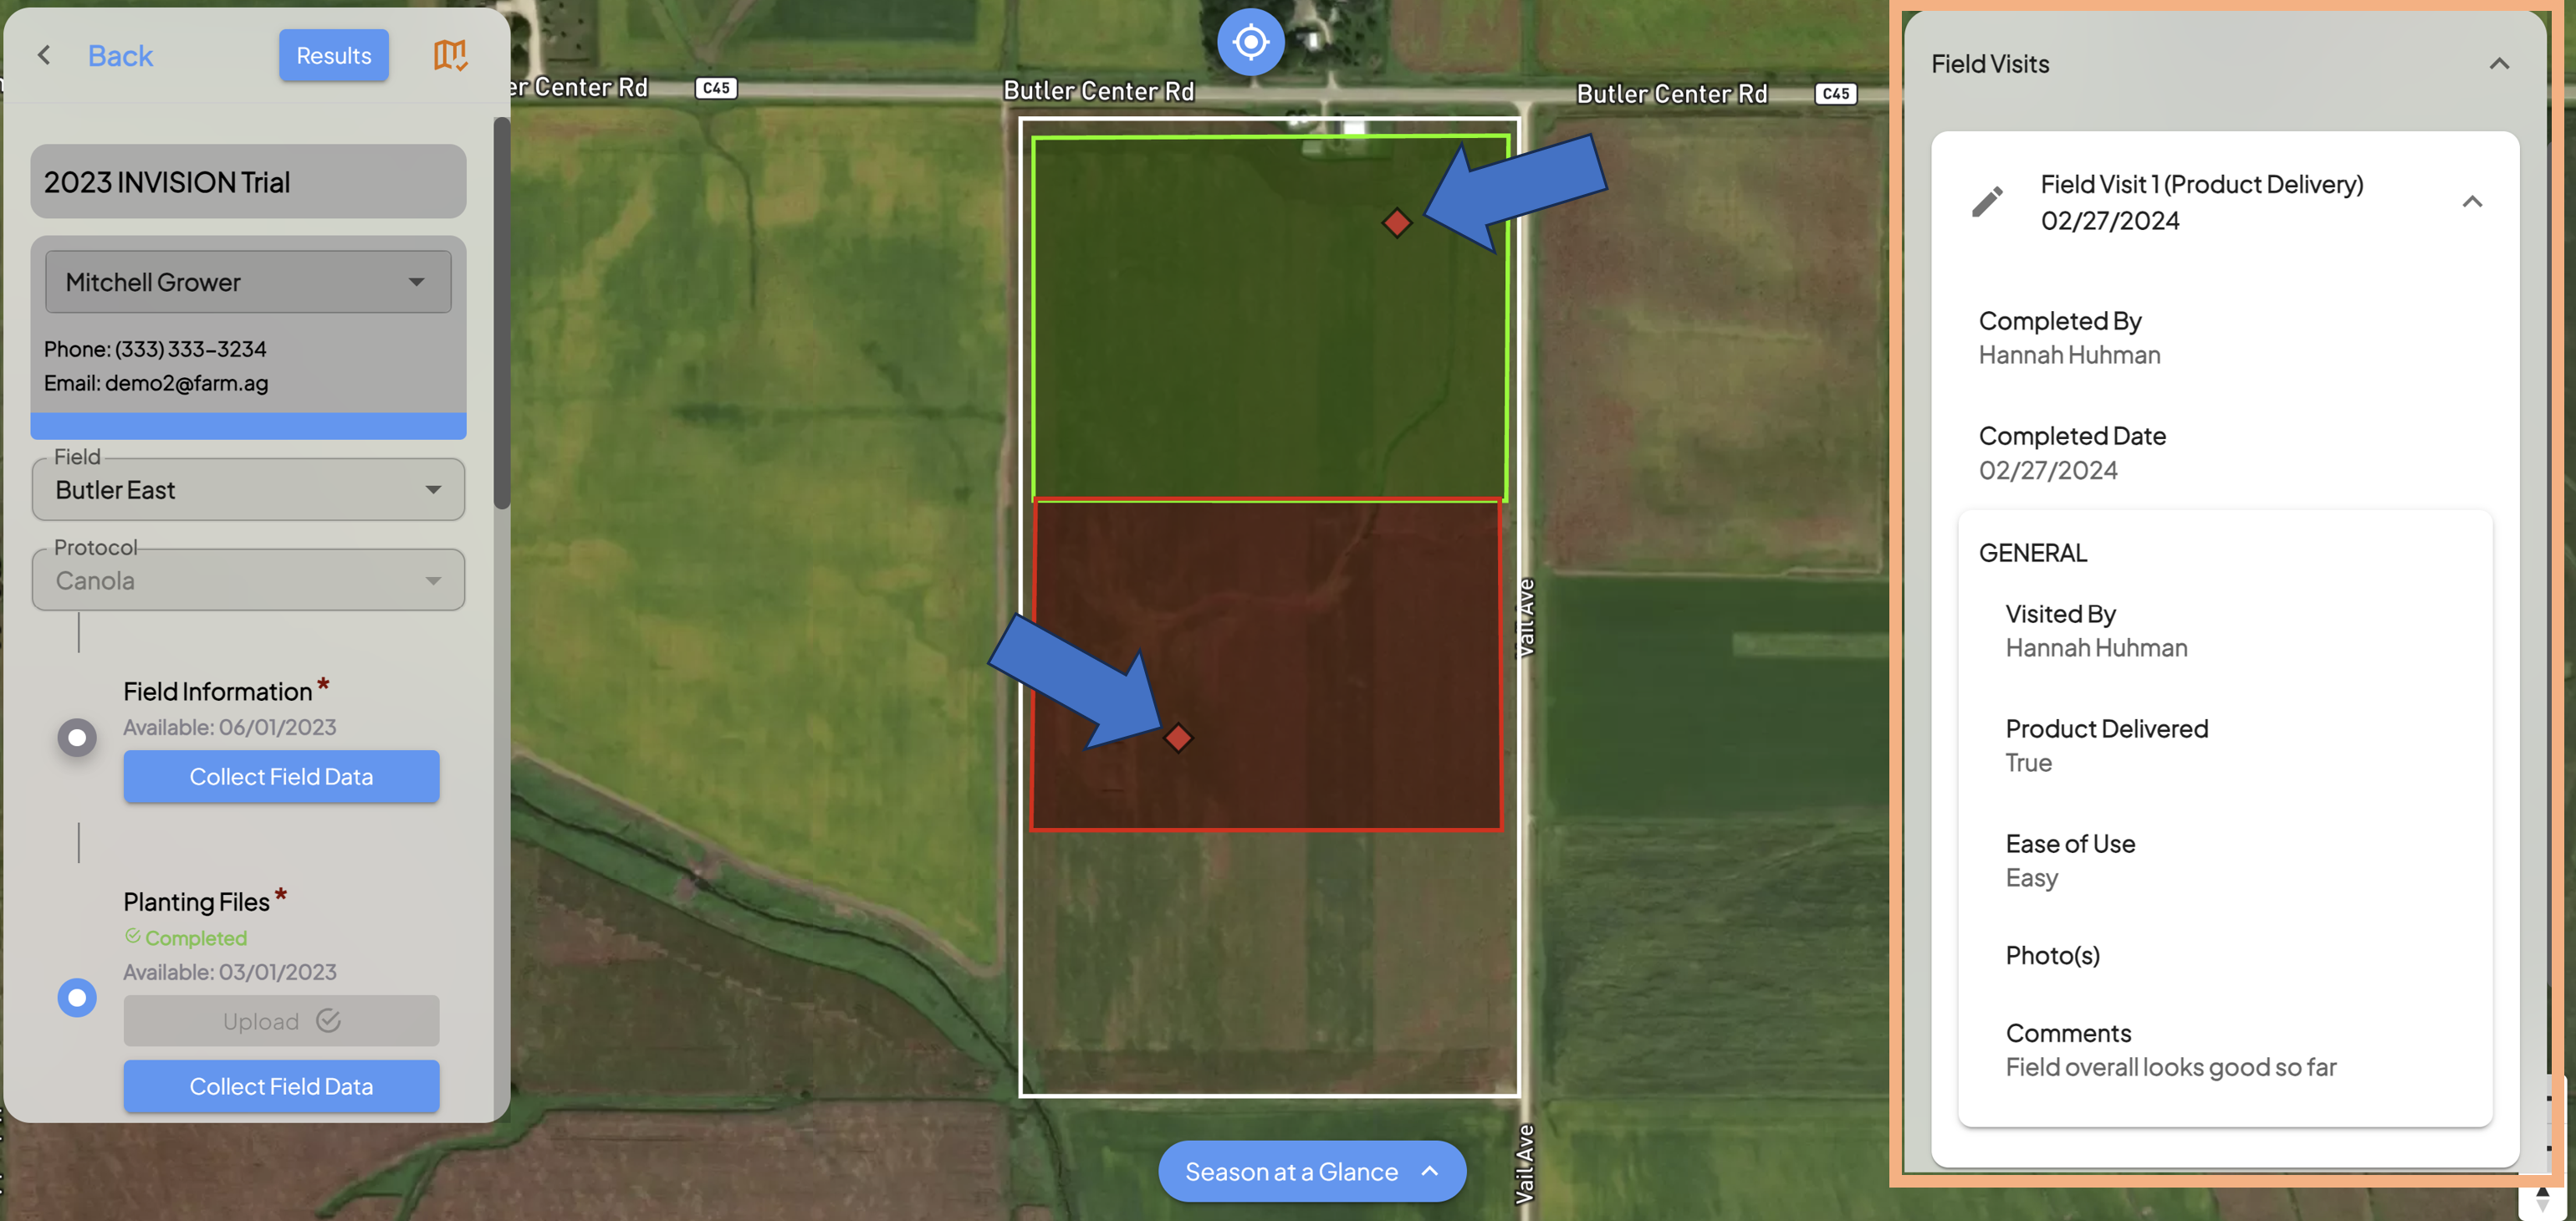
- Field Visits: When users complete field visits through the INVISION Mobile App, the data, including photos and location markers, are shown in View Fields. Users with specific permissions are able to edit the data, location, or photos captured in these field visits from the INVISION Platform.
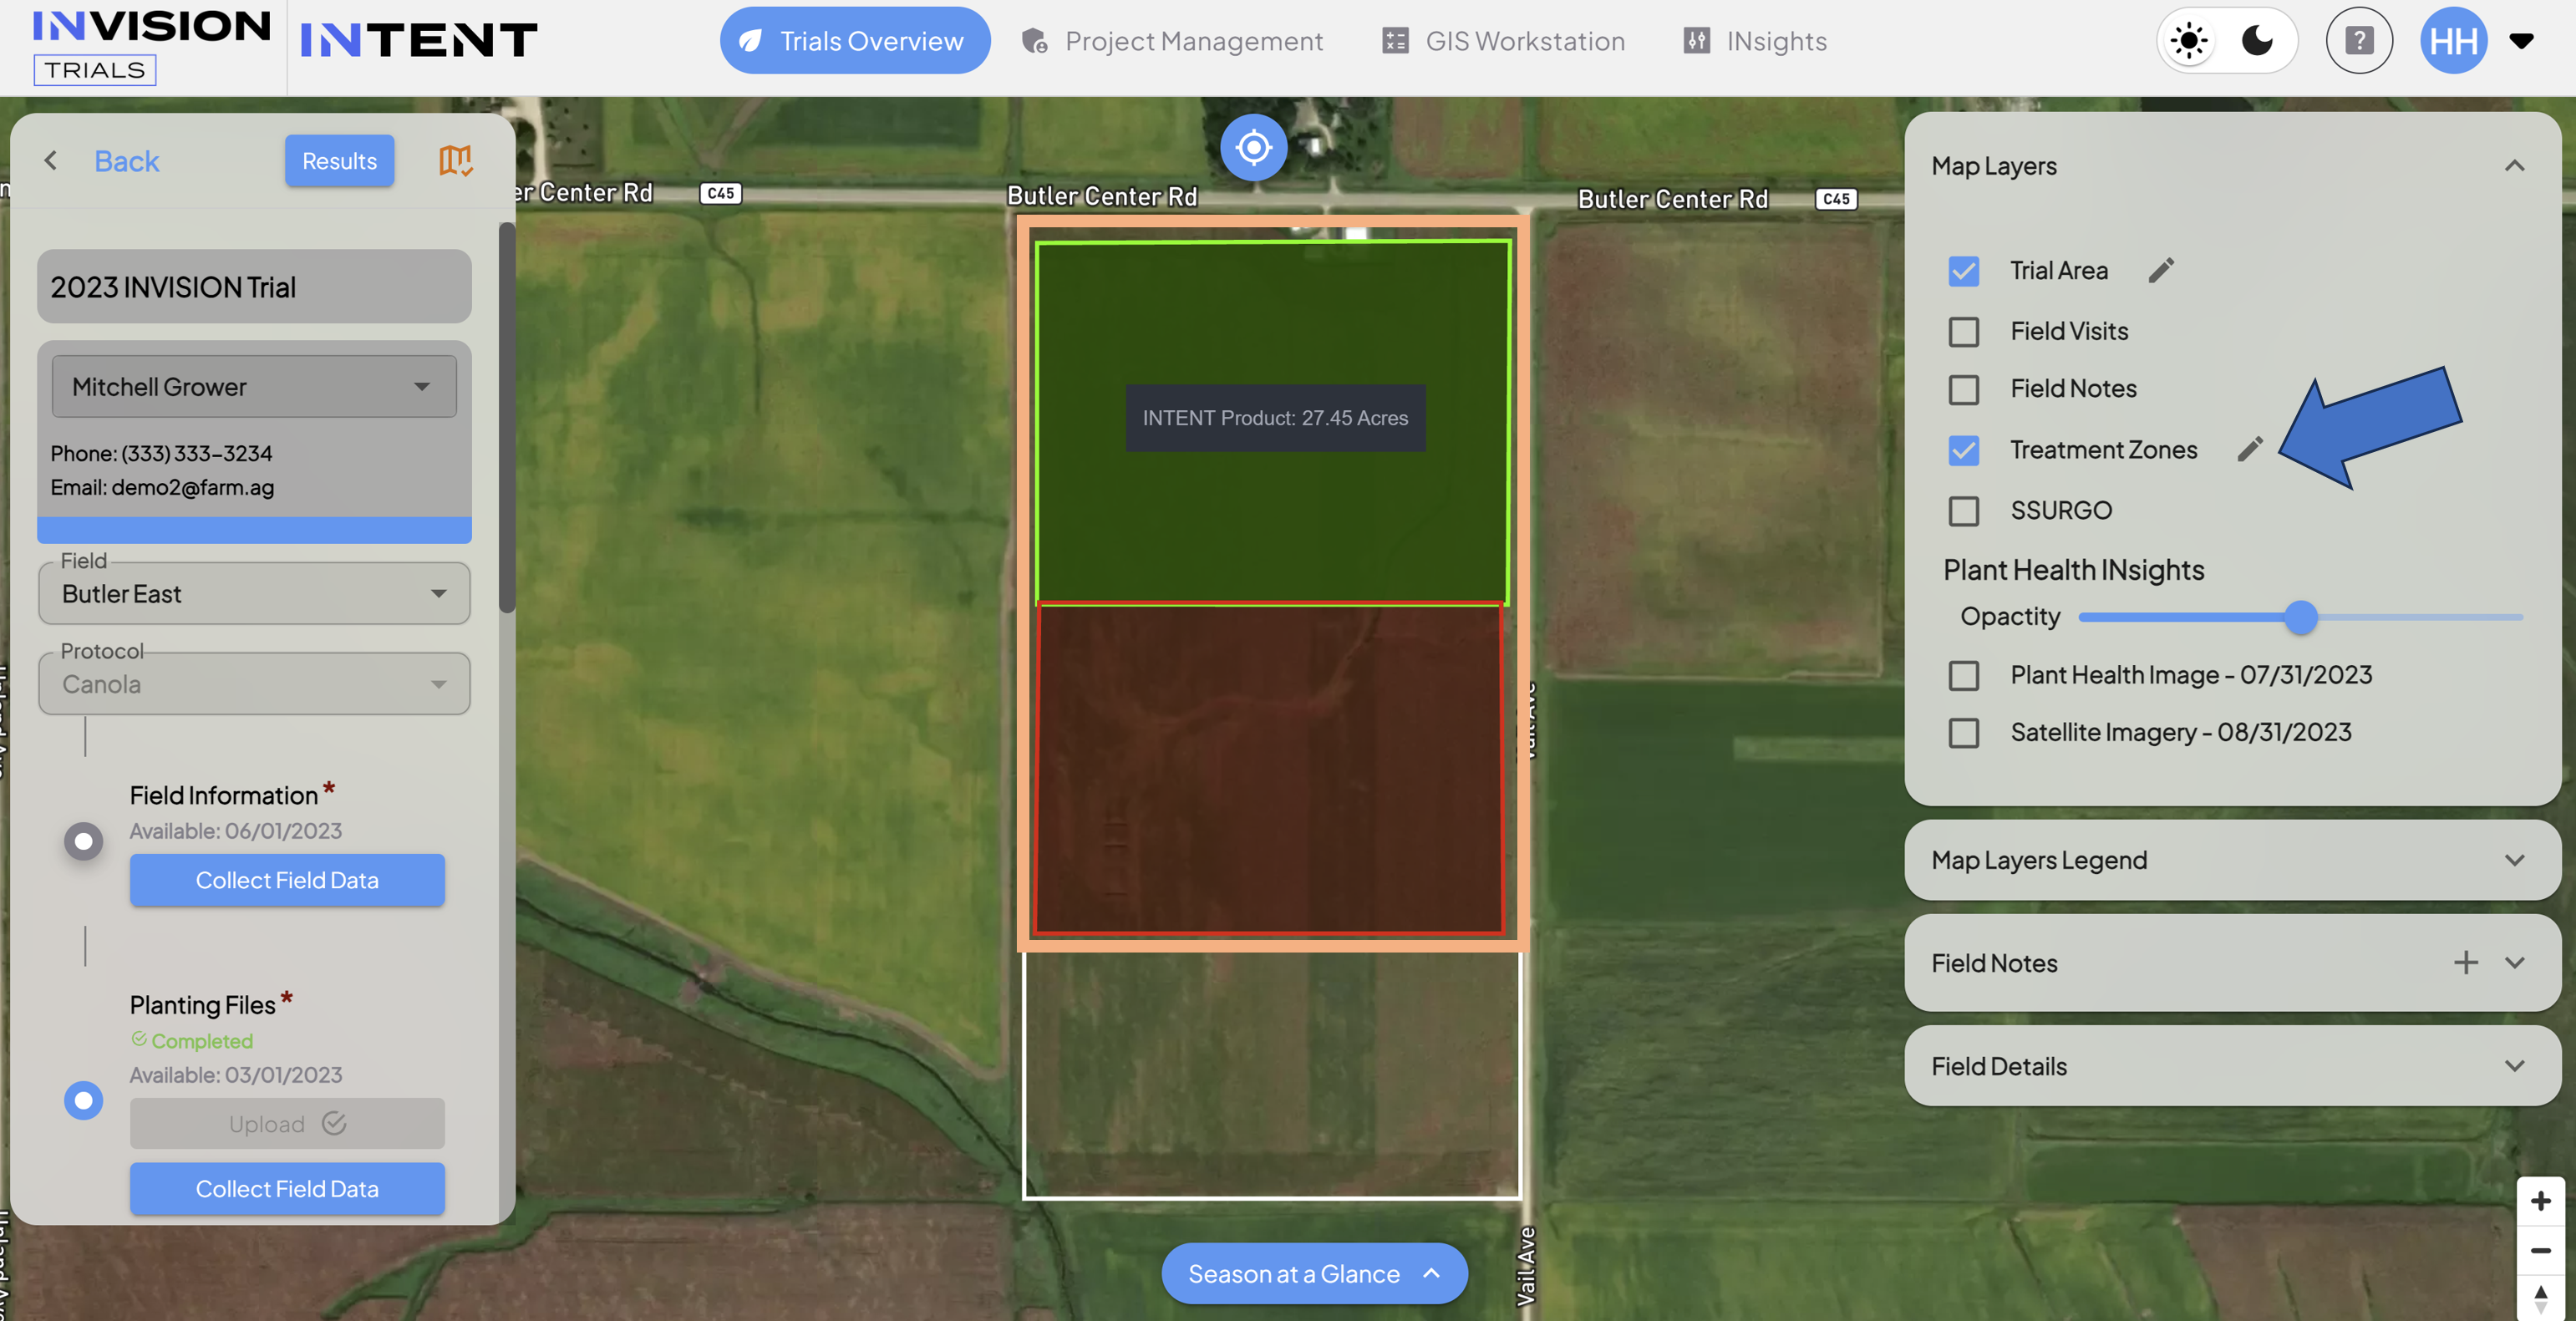
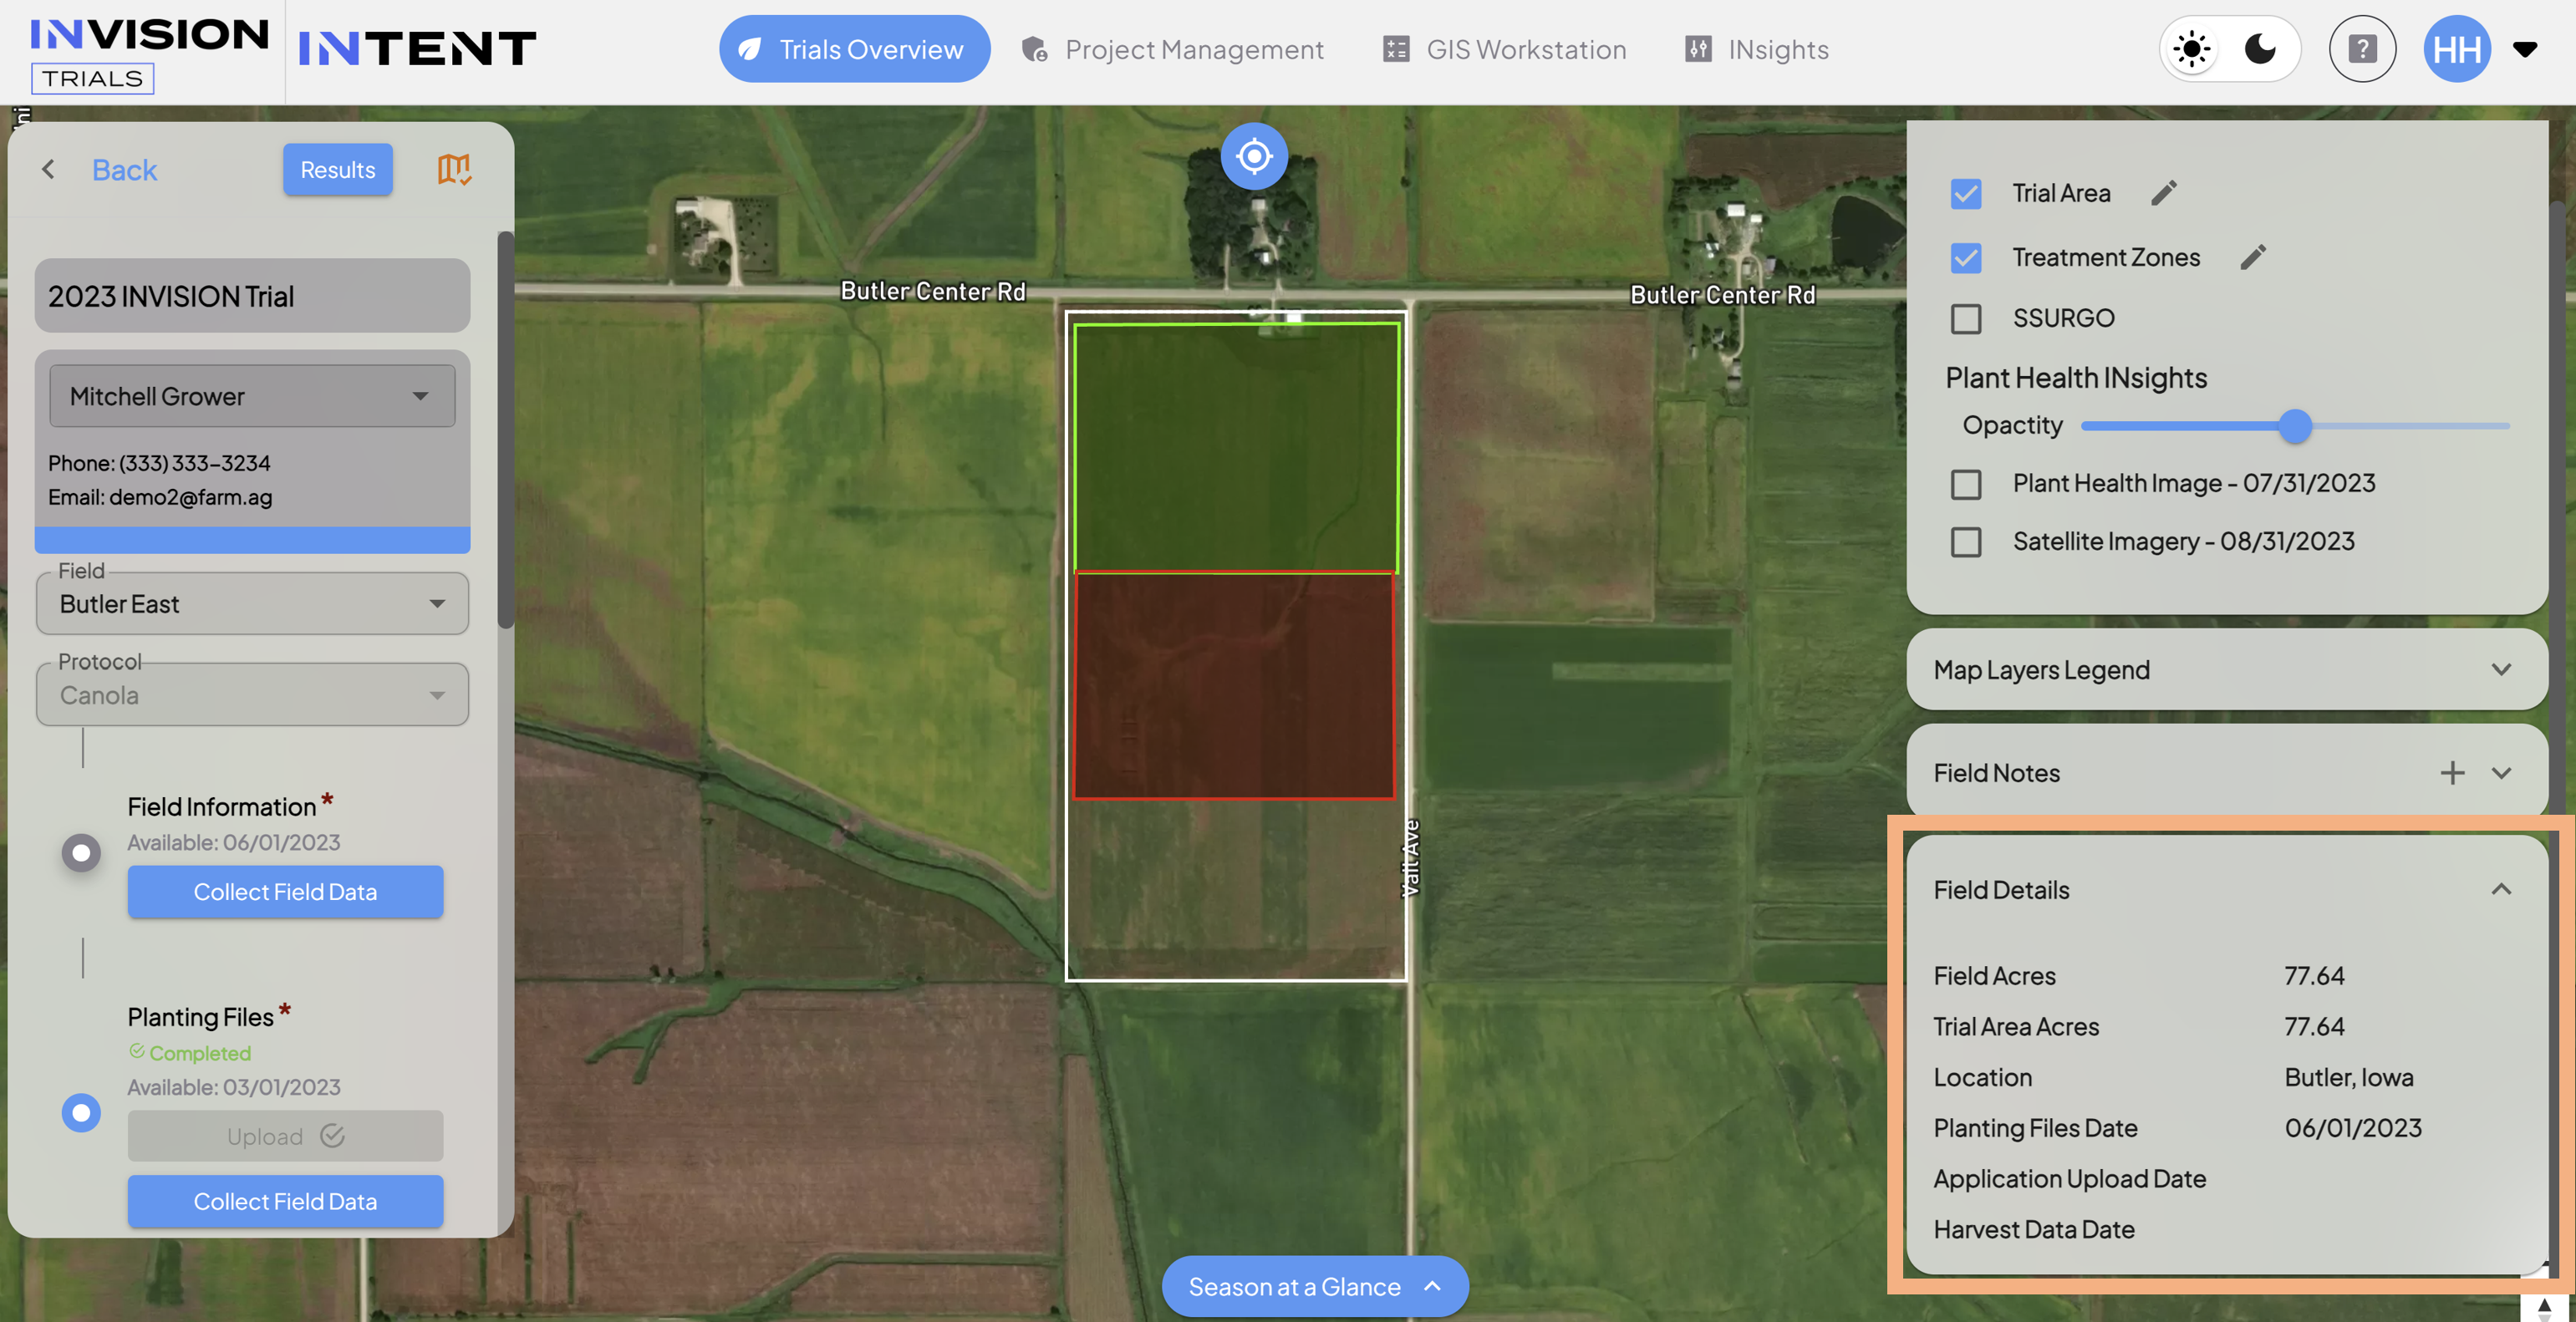
- Treatment Zones: Users with specific permissions can create Treatment Zones for fields. These Treatment Zones represent areas of the field where different treatment procedures are carried out. For example, the green area in the photo below may represent where one area was treated with a different product that was applied to the red area.

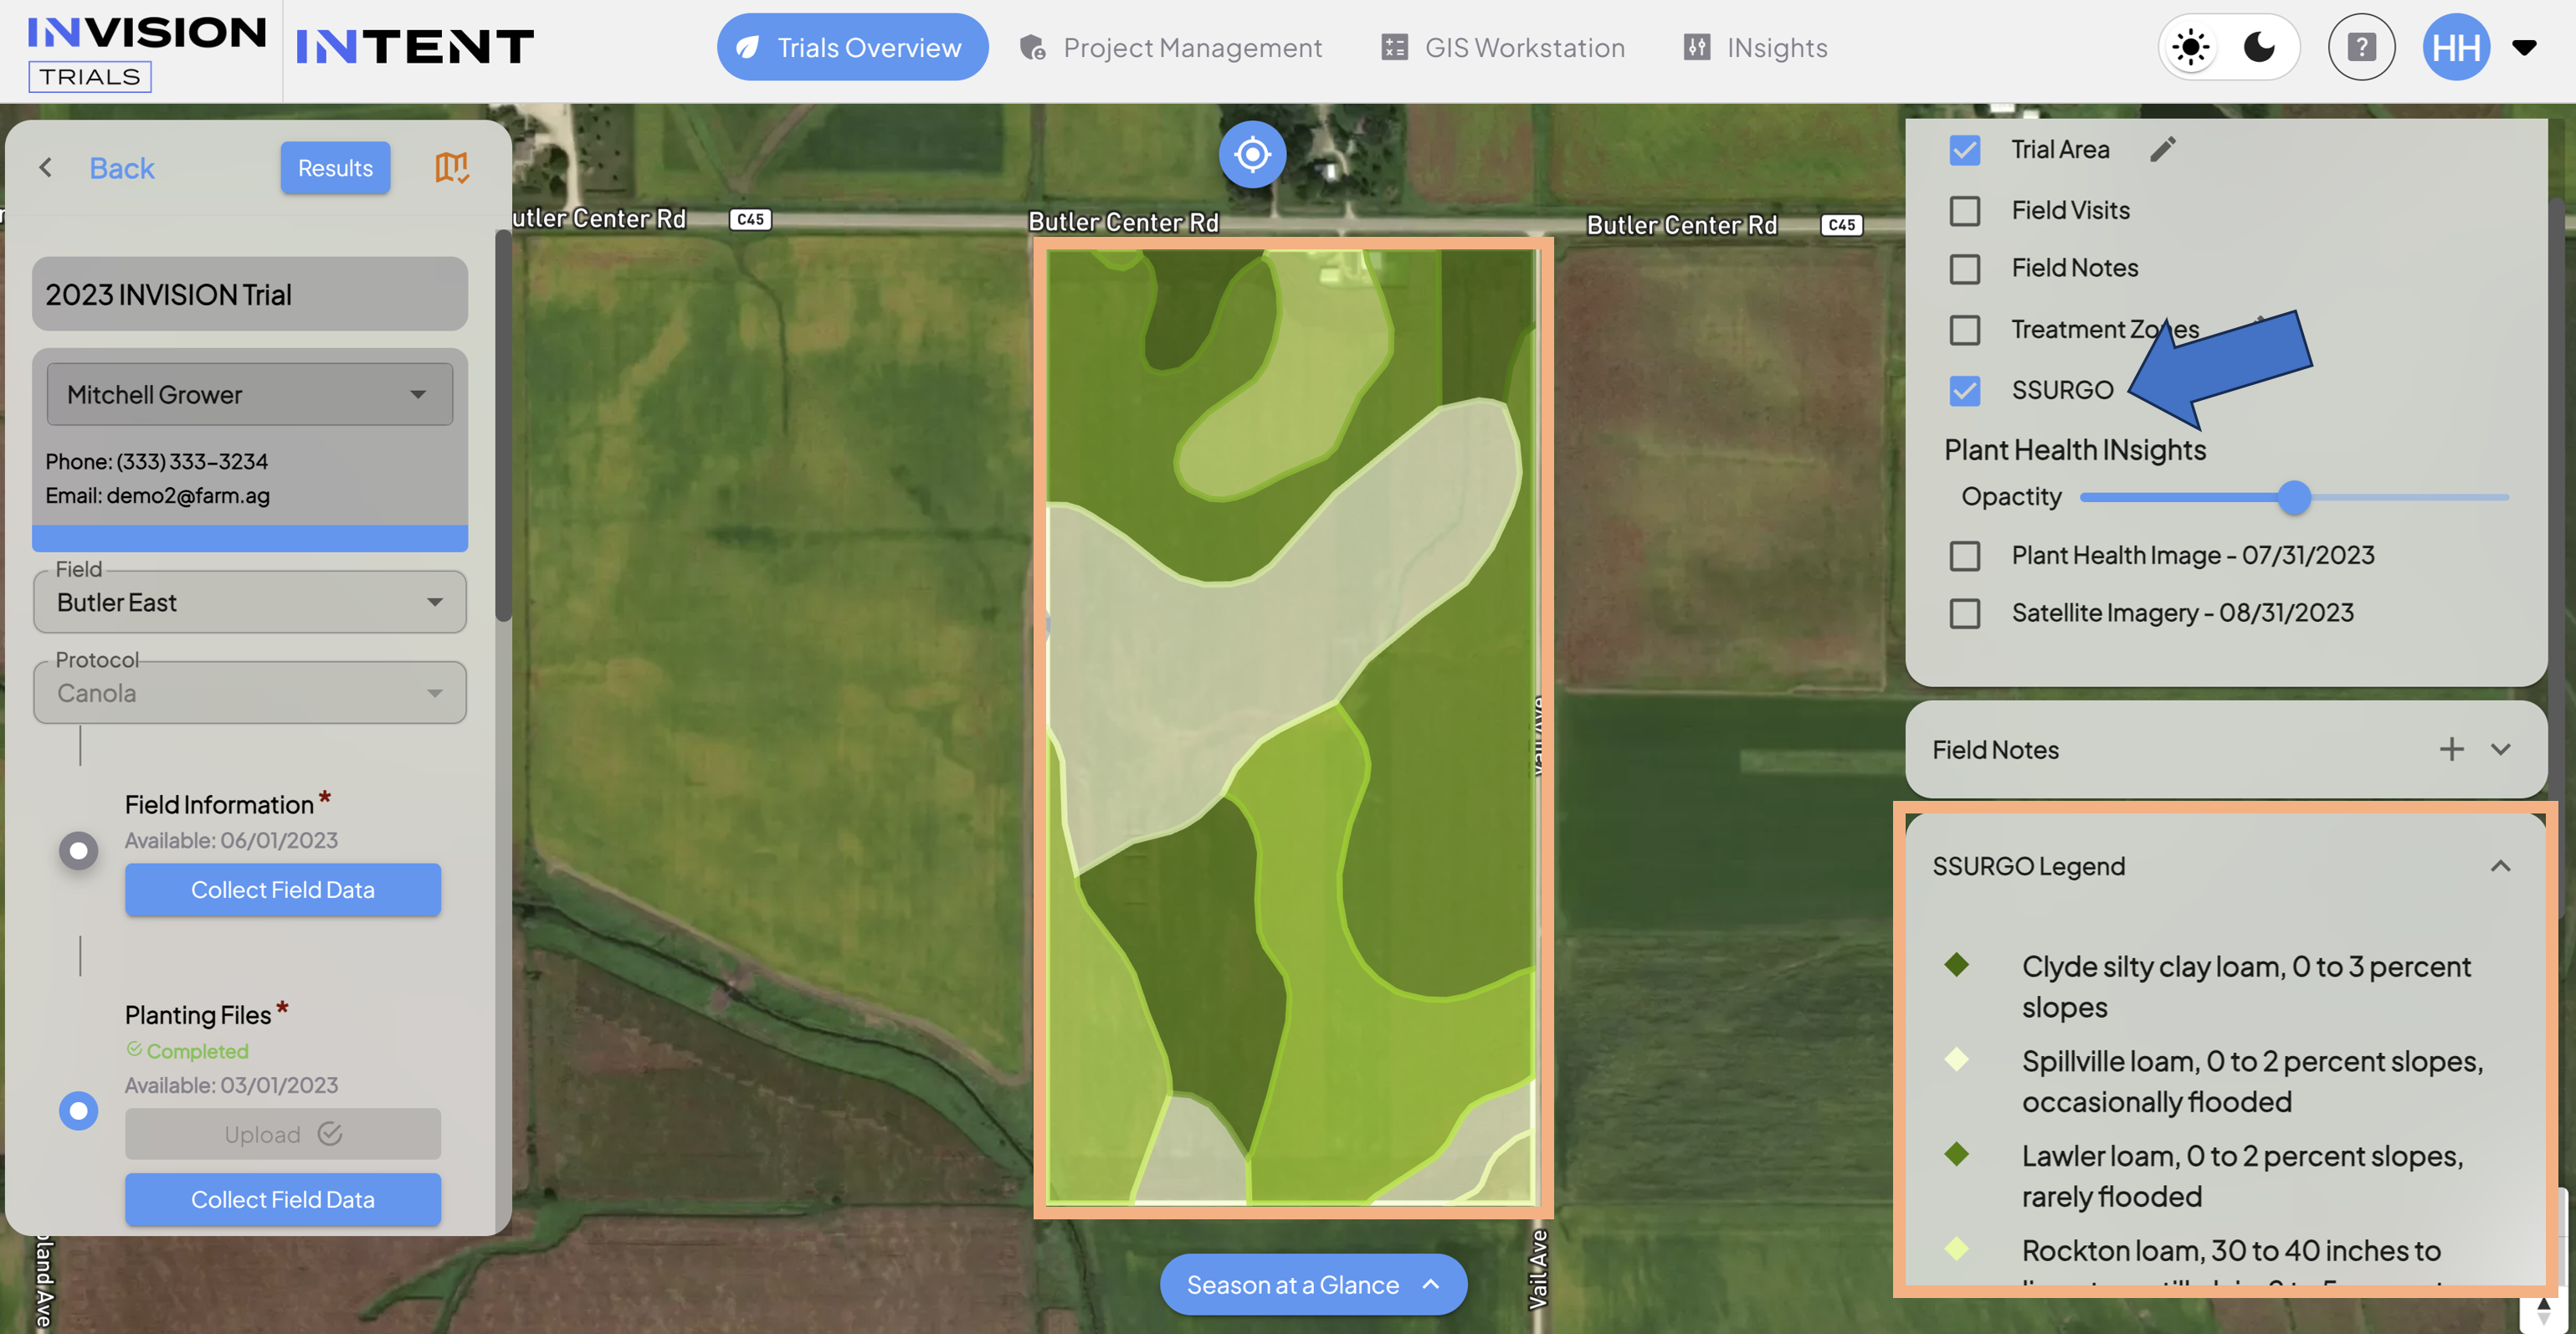
- SSURGO/SWAT: SSURGO layer for the US and SWAT layer for Canada provide information about the soil classification for the the field.

- Trial Area: Users with specific permissions can edit their field boundary for a specific protocol, and the resulting layer is the Trial Area. This is useful if unforeseen circumstances have an impact on the field, for example, flooding in a particular area of the field prevents the application of a product. In that case, the area of the field that is still active in the trial can be outline with the Trial Area.
- Map Layers Legend:
- Location: Right side of View Fields.
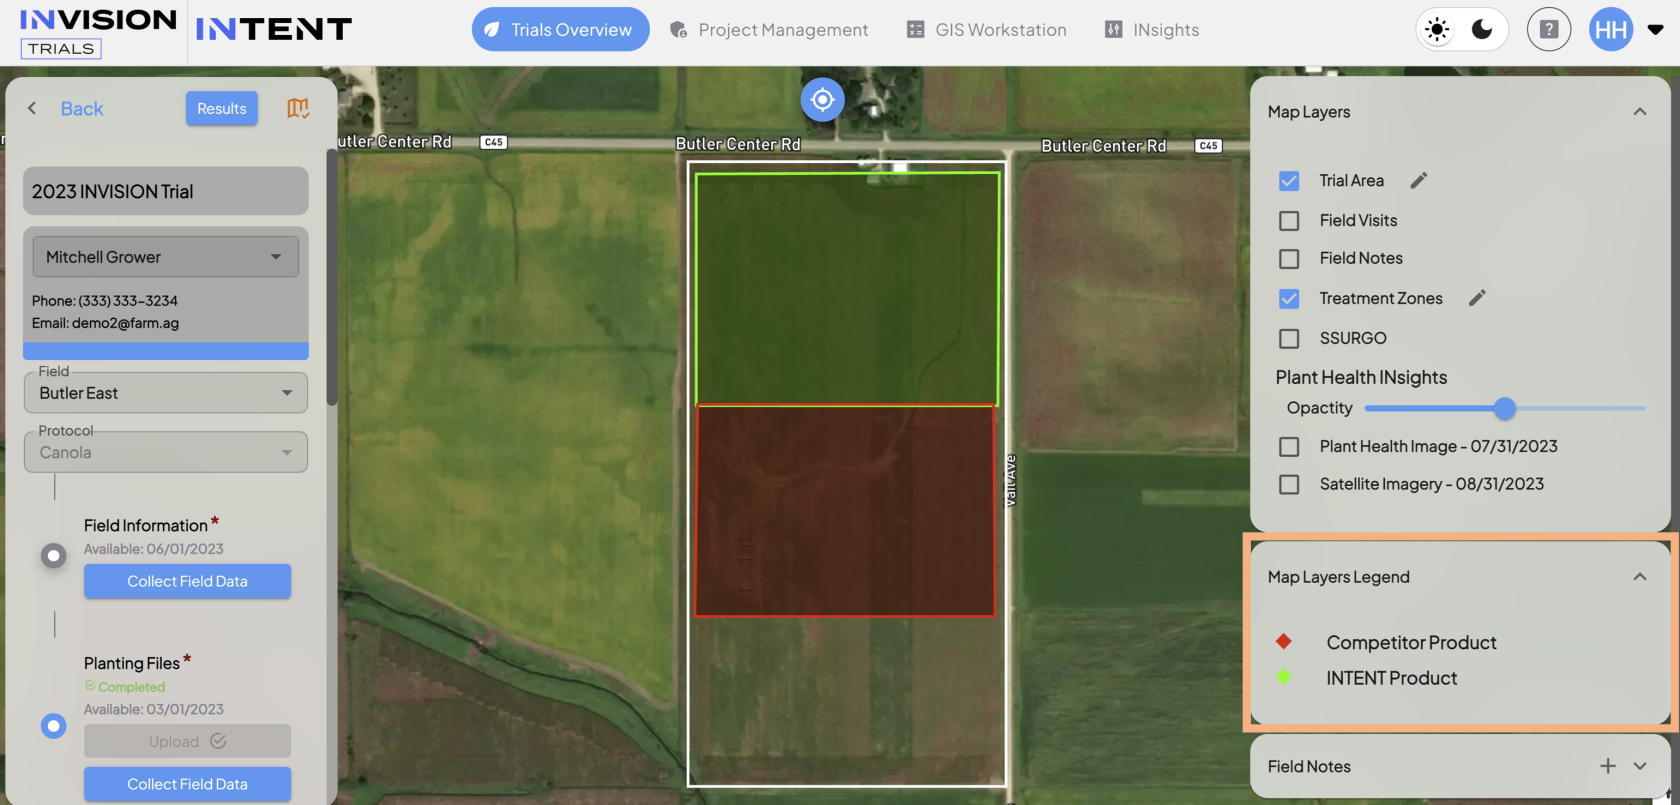
- Function: Provides context for the layers displayed on the map.
- Location: Right side of View Fields.
- Field Visits
- Location: Right side of View Fields.

- Function: Displays the data captured during field visits, including location markers shown on the map.
- Location: Right side of View Fields.
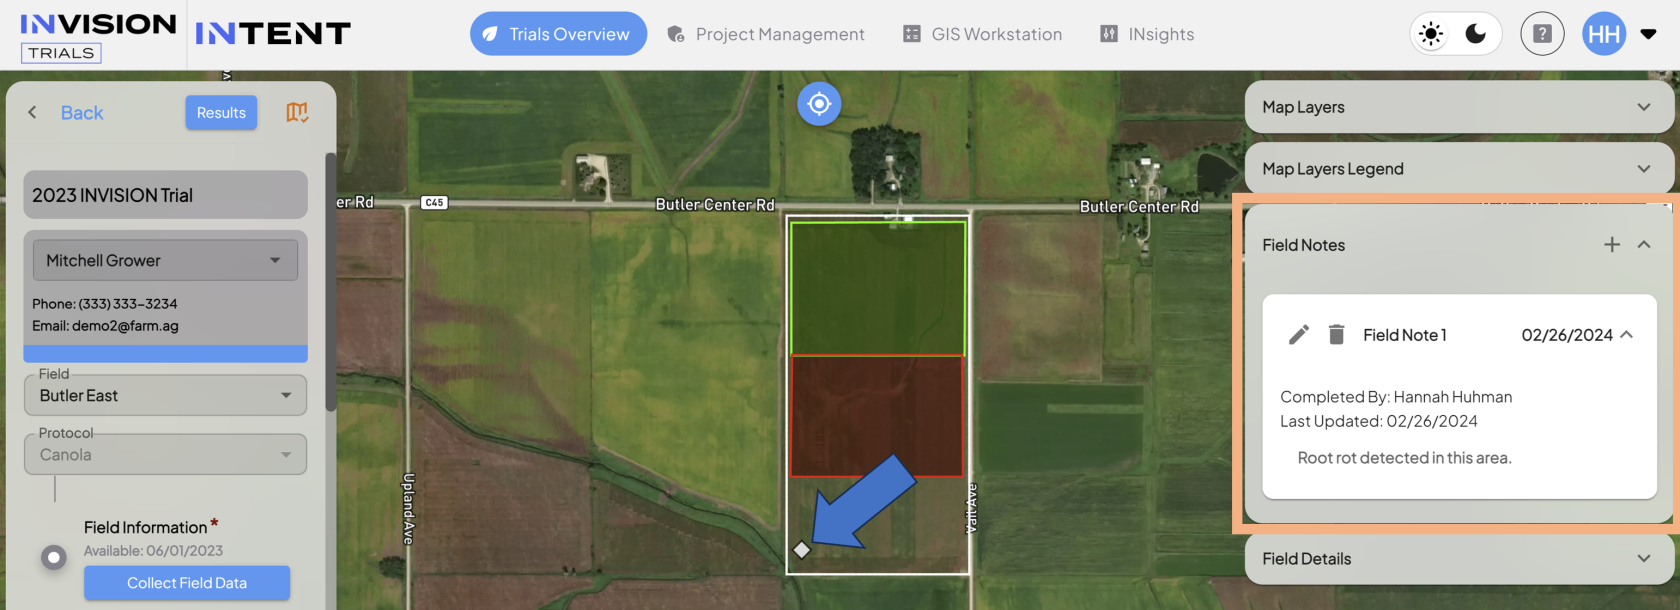
- Field Notes:
- Location: Right side of View Fields.
- Function: Displays the data captured in field notes, including a location marker shown on the map.
- Field Details:
- Location: Right side of View Fields.

- Function: Displays quick facts about the field shown on the map.
- Location: Right side of View Fields.
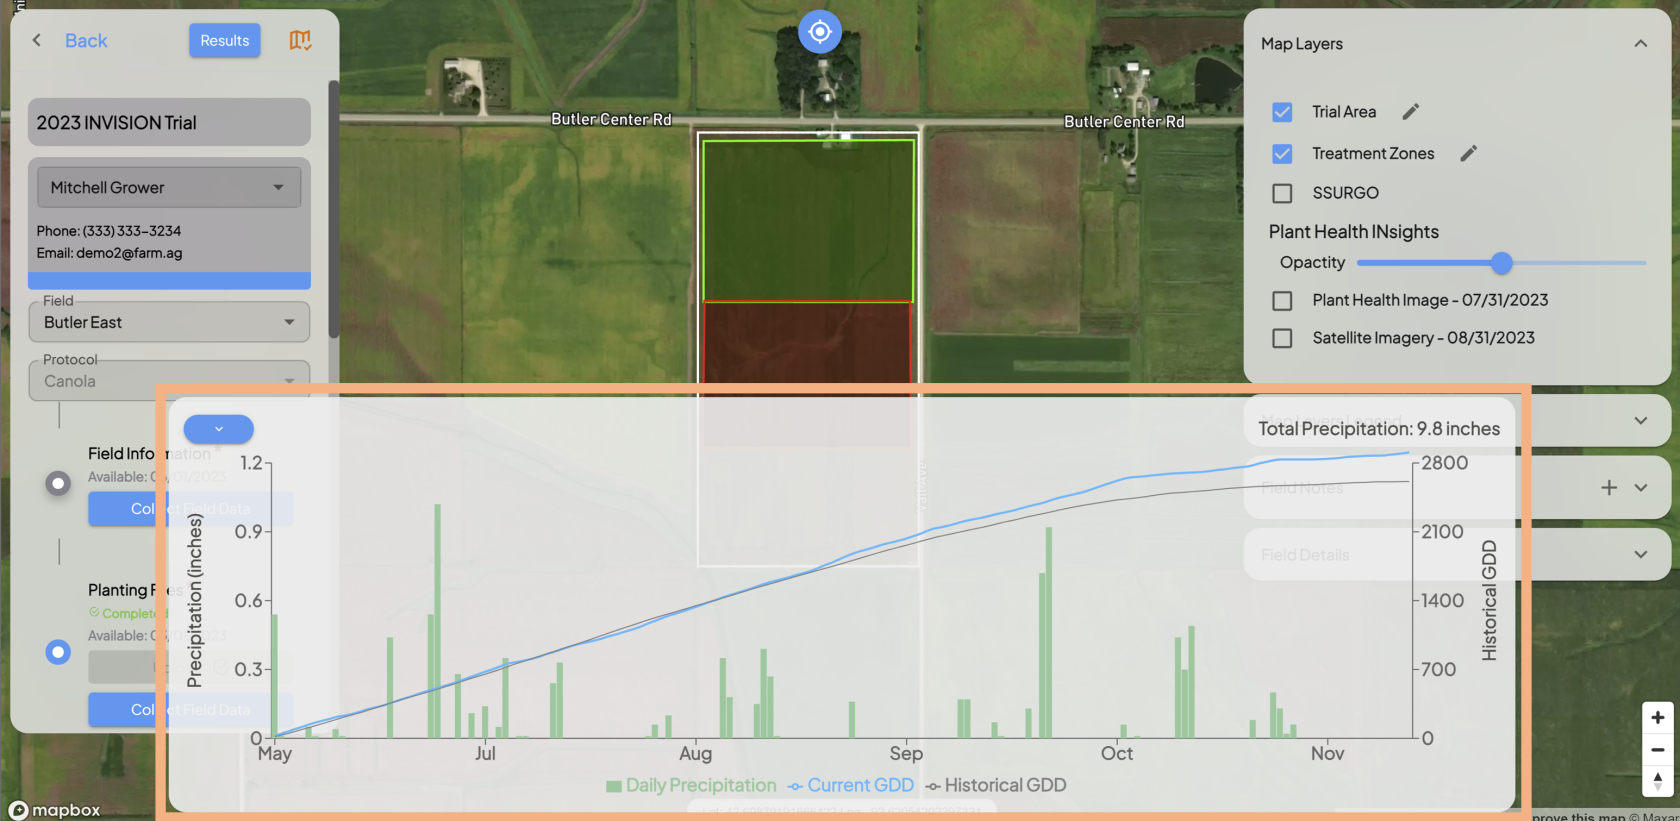
- Season at a Glance:
- Location: Bottom center of the map.
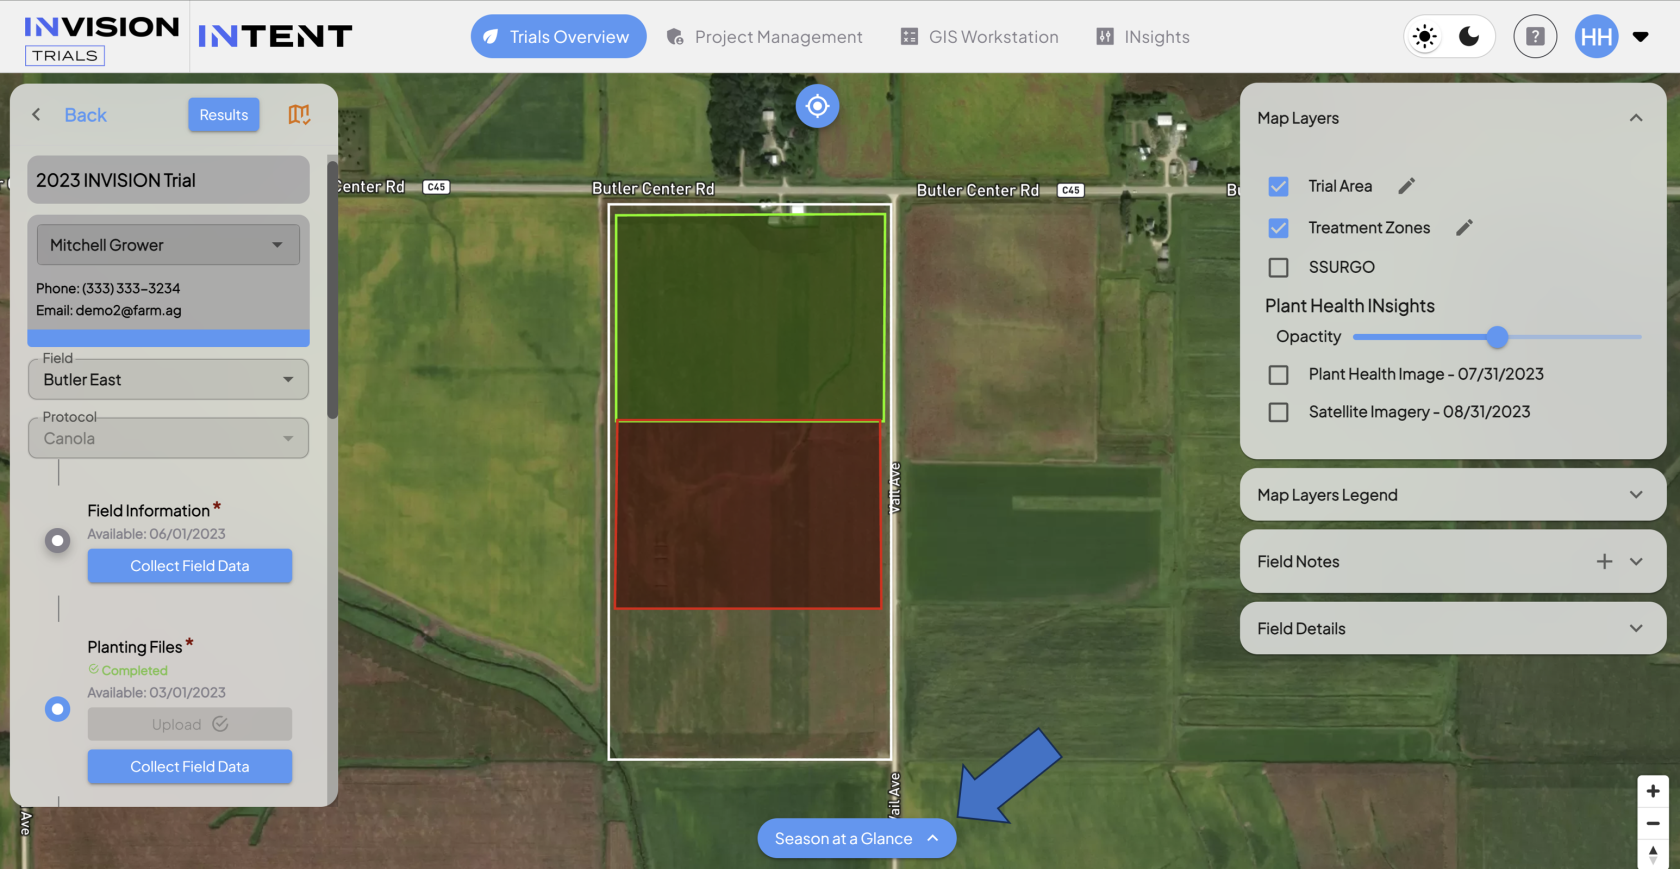
- Function: A chart which displays Precipitation on the left vertical axes, Historical Growing Degree Days on the right vertical access, and time (in months) on the horizontal access.
- Location: Bottom center of the map.


For additional help, follow along with this video for a tour of View Fields: