September 2025 Release v3.12.0
INVISION v3.12.0 is our most comprehensive Insights release to date, transforming how users analyze, configure, and share results across trials and field programs.
Historically, Insights has been built around yield data which is valuable, but limiting for those collecting broader on-farm information. Many of our partners track farmer practices, field information, soil properties, planting details, and seasonal observations. That data that’s always existed in INVISION but wasn’t easy to analyze together.
With this release, Insights now brings all of it yield data, field visit data, and field and management information into one cohesive, visual experience.
Highlights
1. INSIGHTS | Aggregate Reports Redesign
The redesigned Insights experience gives users a single place to explore and understand everything collected throughout the growing season whether that’s from field visits, surveys, or trial setup.
This release focuses on making field-level data more usable and meaningful not by introducing new metrics, but by unlocking the value of the data that’s already being collected through consistent setup and field activity.
All the information that appears in Insights comes from what’s configured and collected in INVISION projects. Each project defines its own Field Visit Questions, Field Information, Survey Questions, Commercial Program questions, etc. and those now drive what can be visualized and aggregated inside Insights.
For example:
- Field Visits → observations such as stand counts, biomass weights, trial ratings, or photos.
- Field Information → irrigation, soil type, tillage system, soil CEC, or management practices.
- Planting & Operation Details → hybrid or variety, planting date, prior crop, and other setup attributes.
When these are properly configured and collected, Insights automatically aggregates and displays them letting teams explore relationships, trends, and differences across fields, products, or management practices.
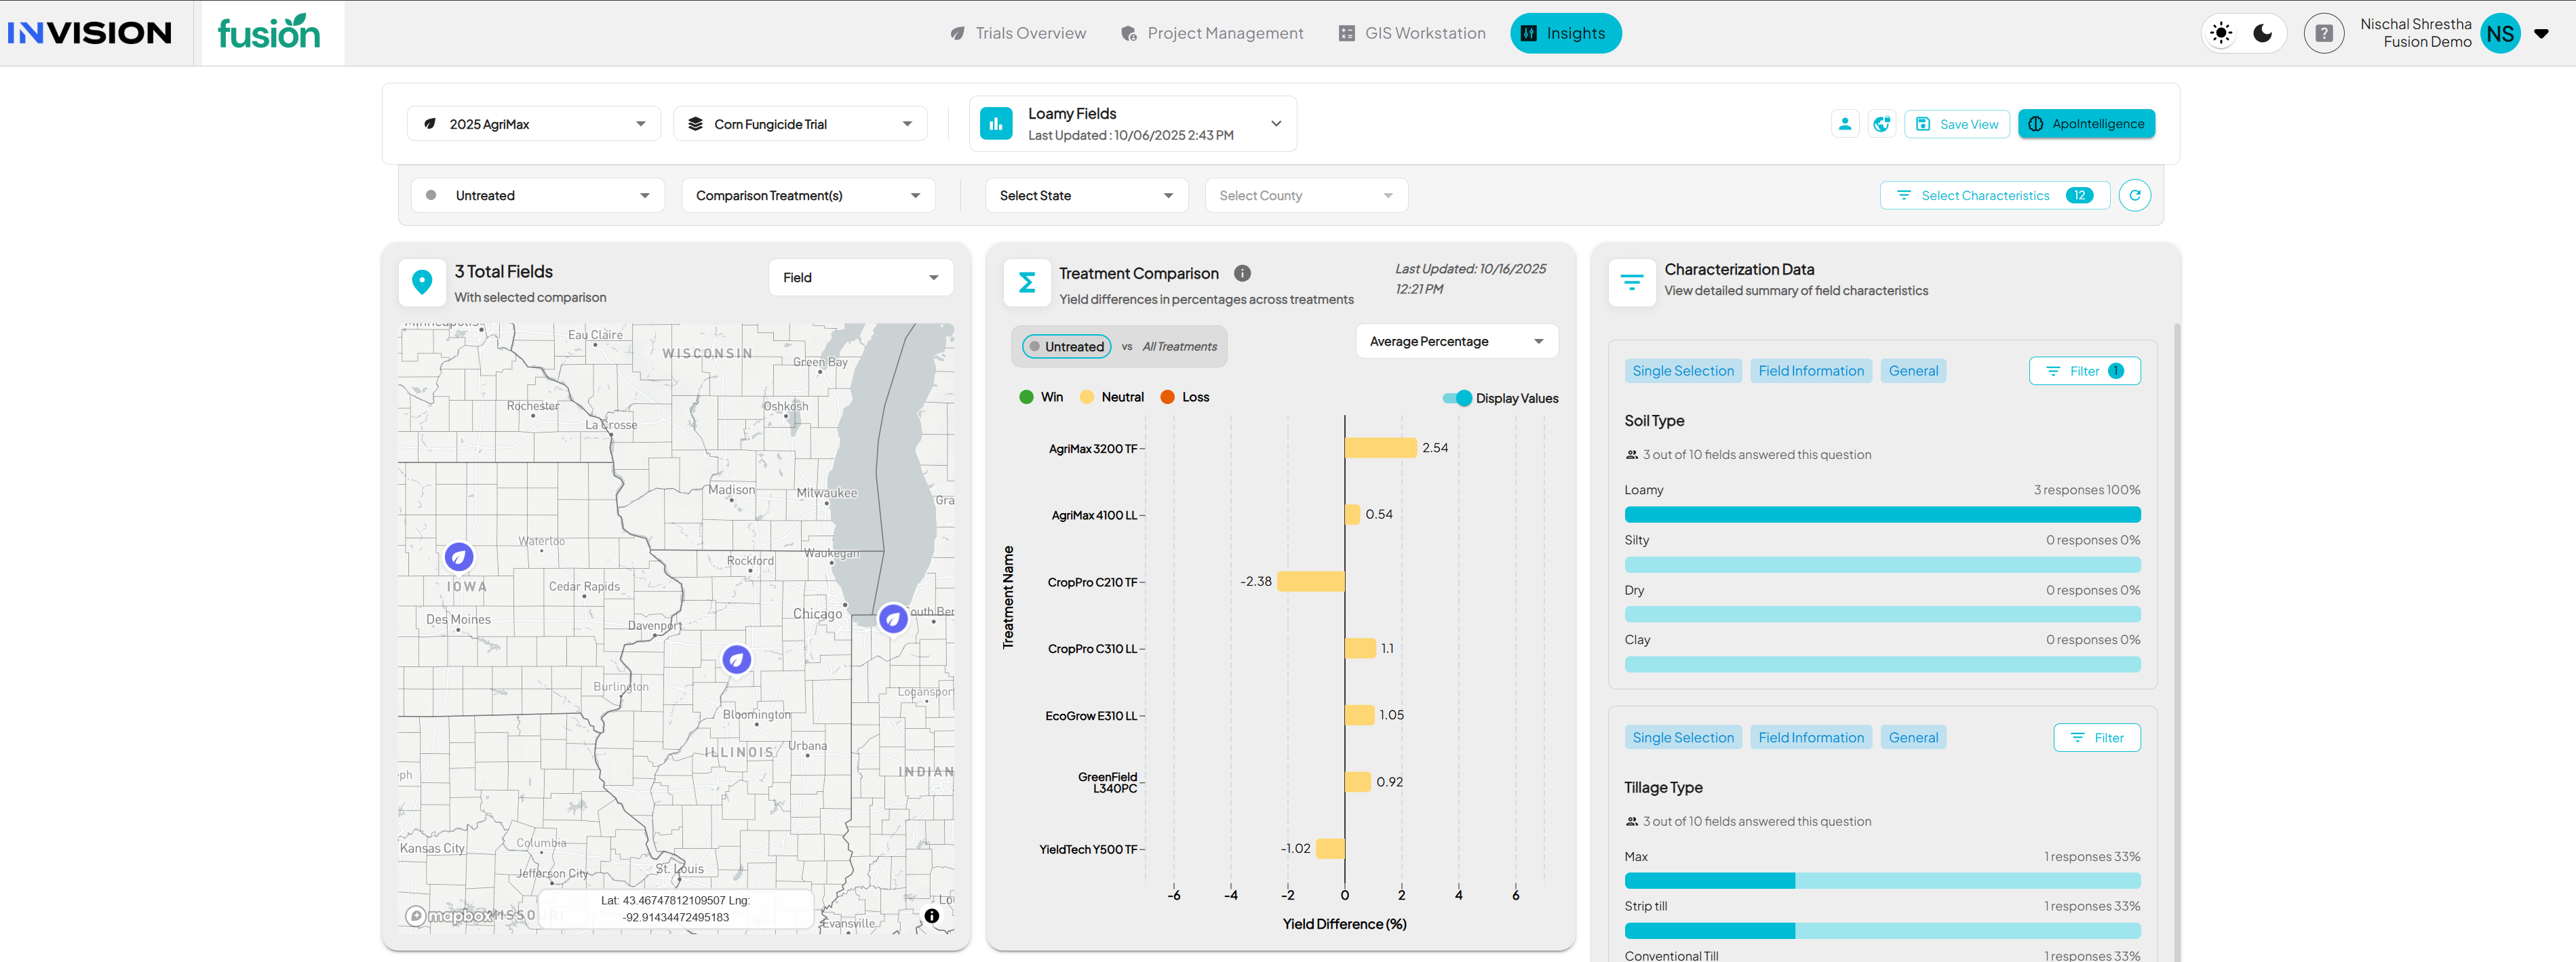
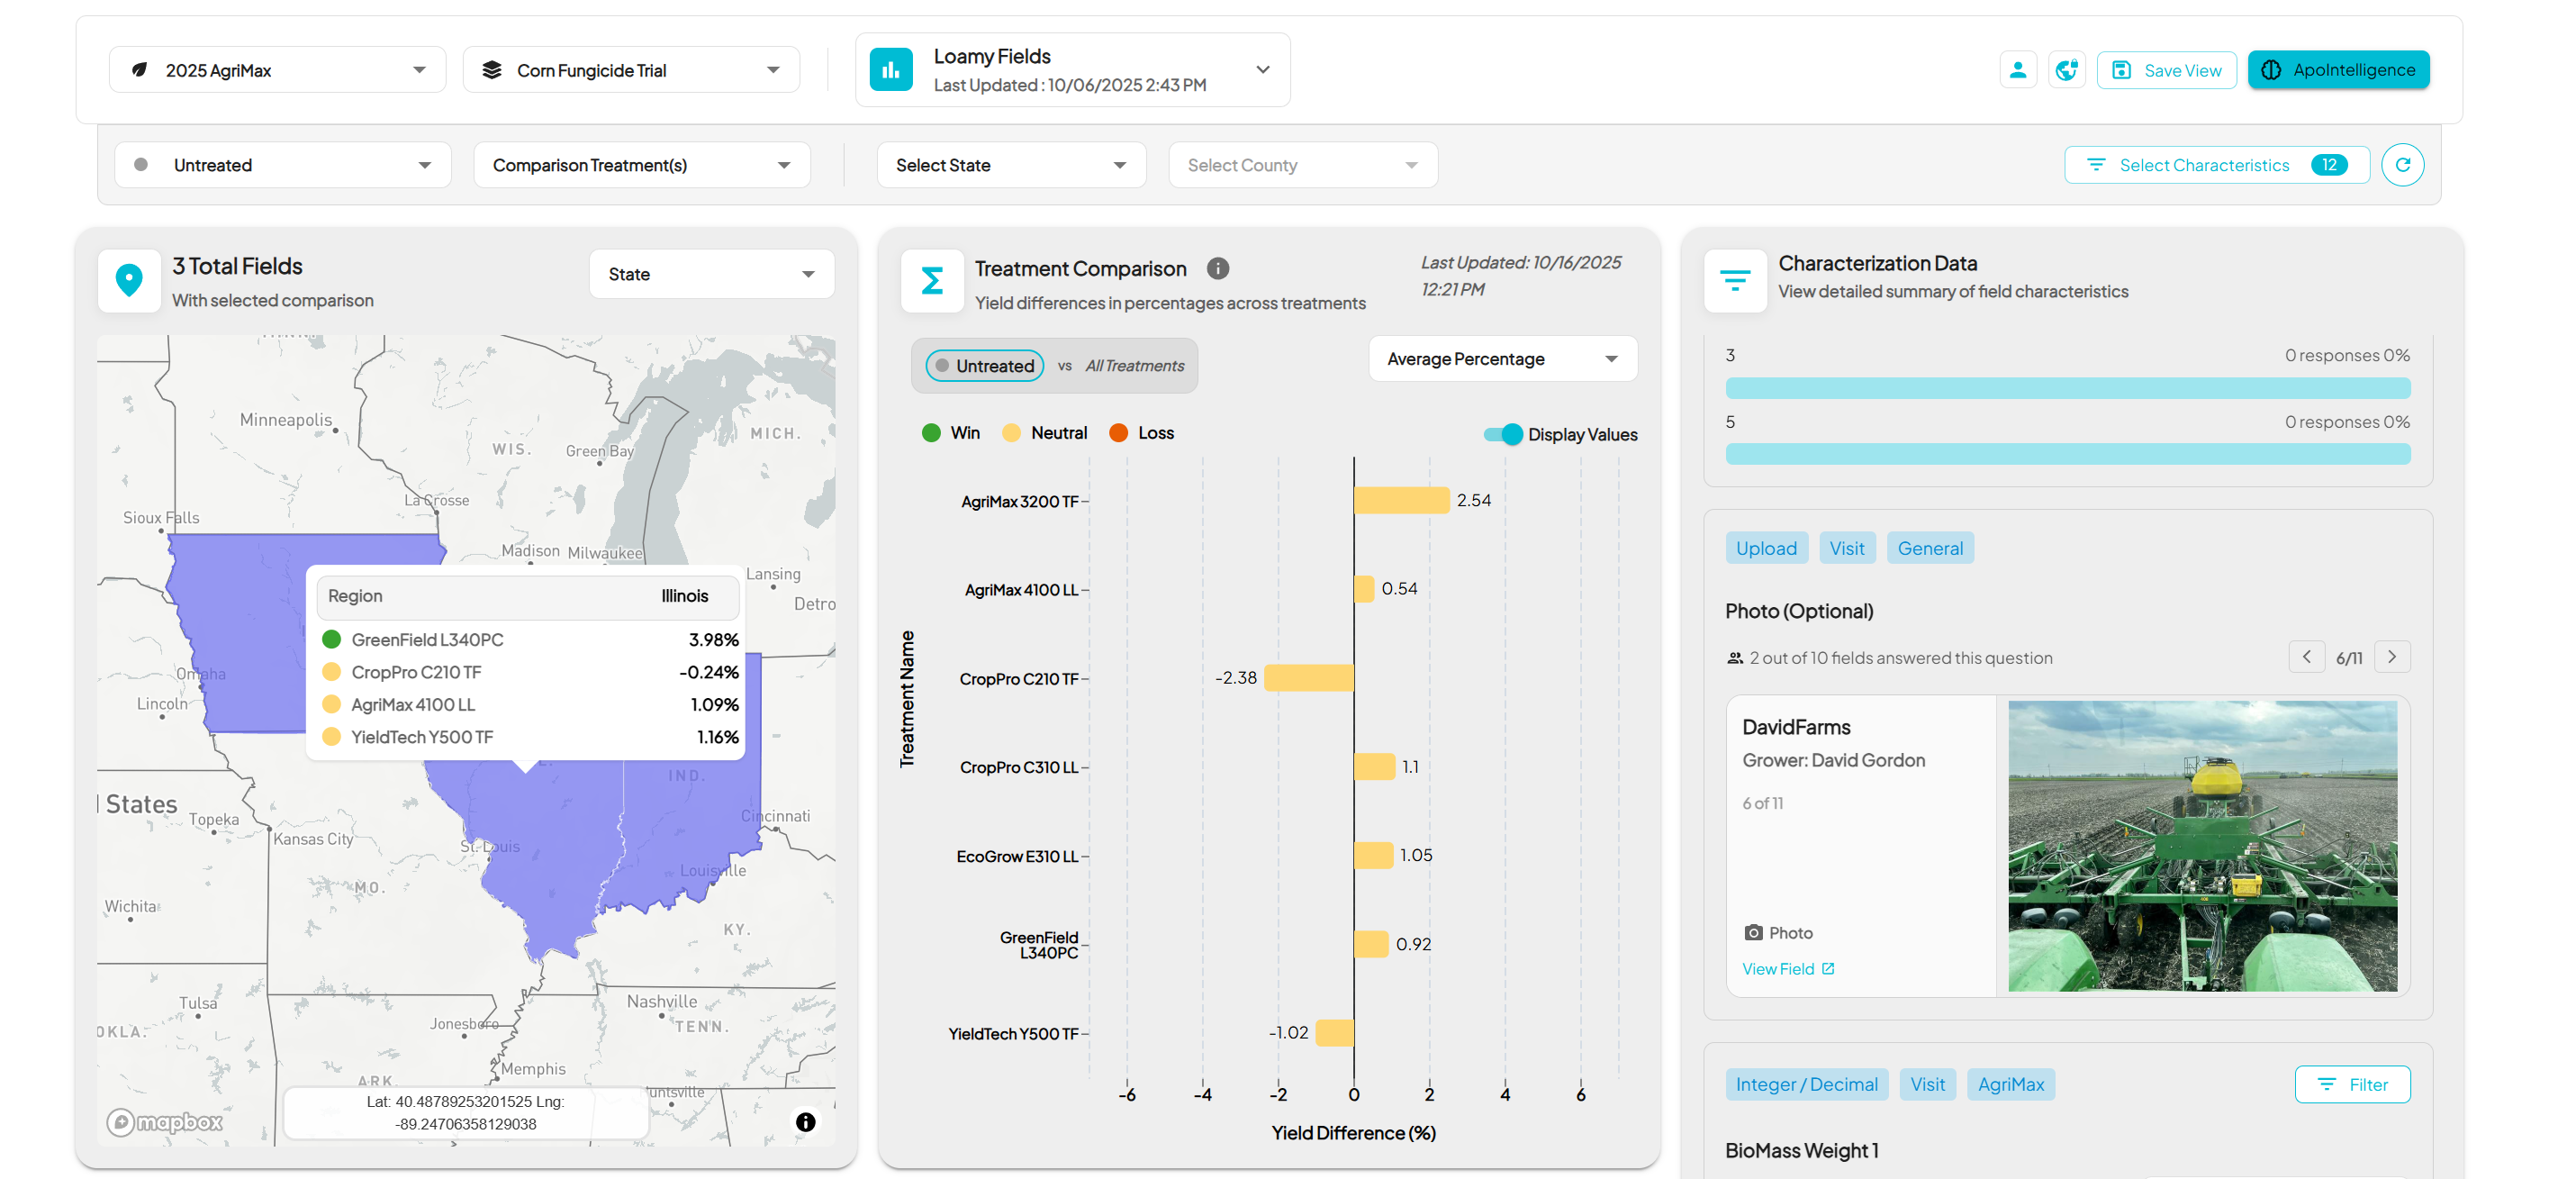
Unified Data View: Exports with Yield and Characteristics
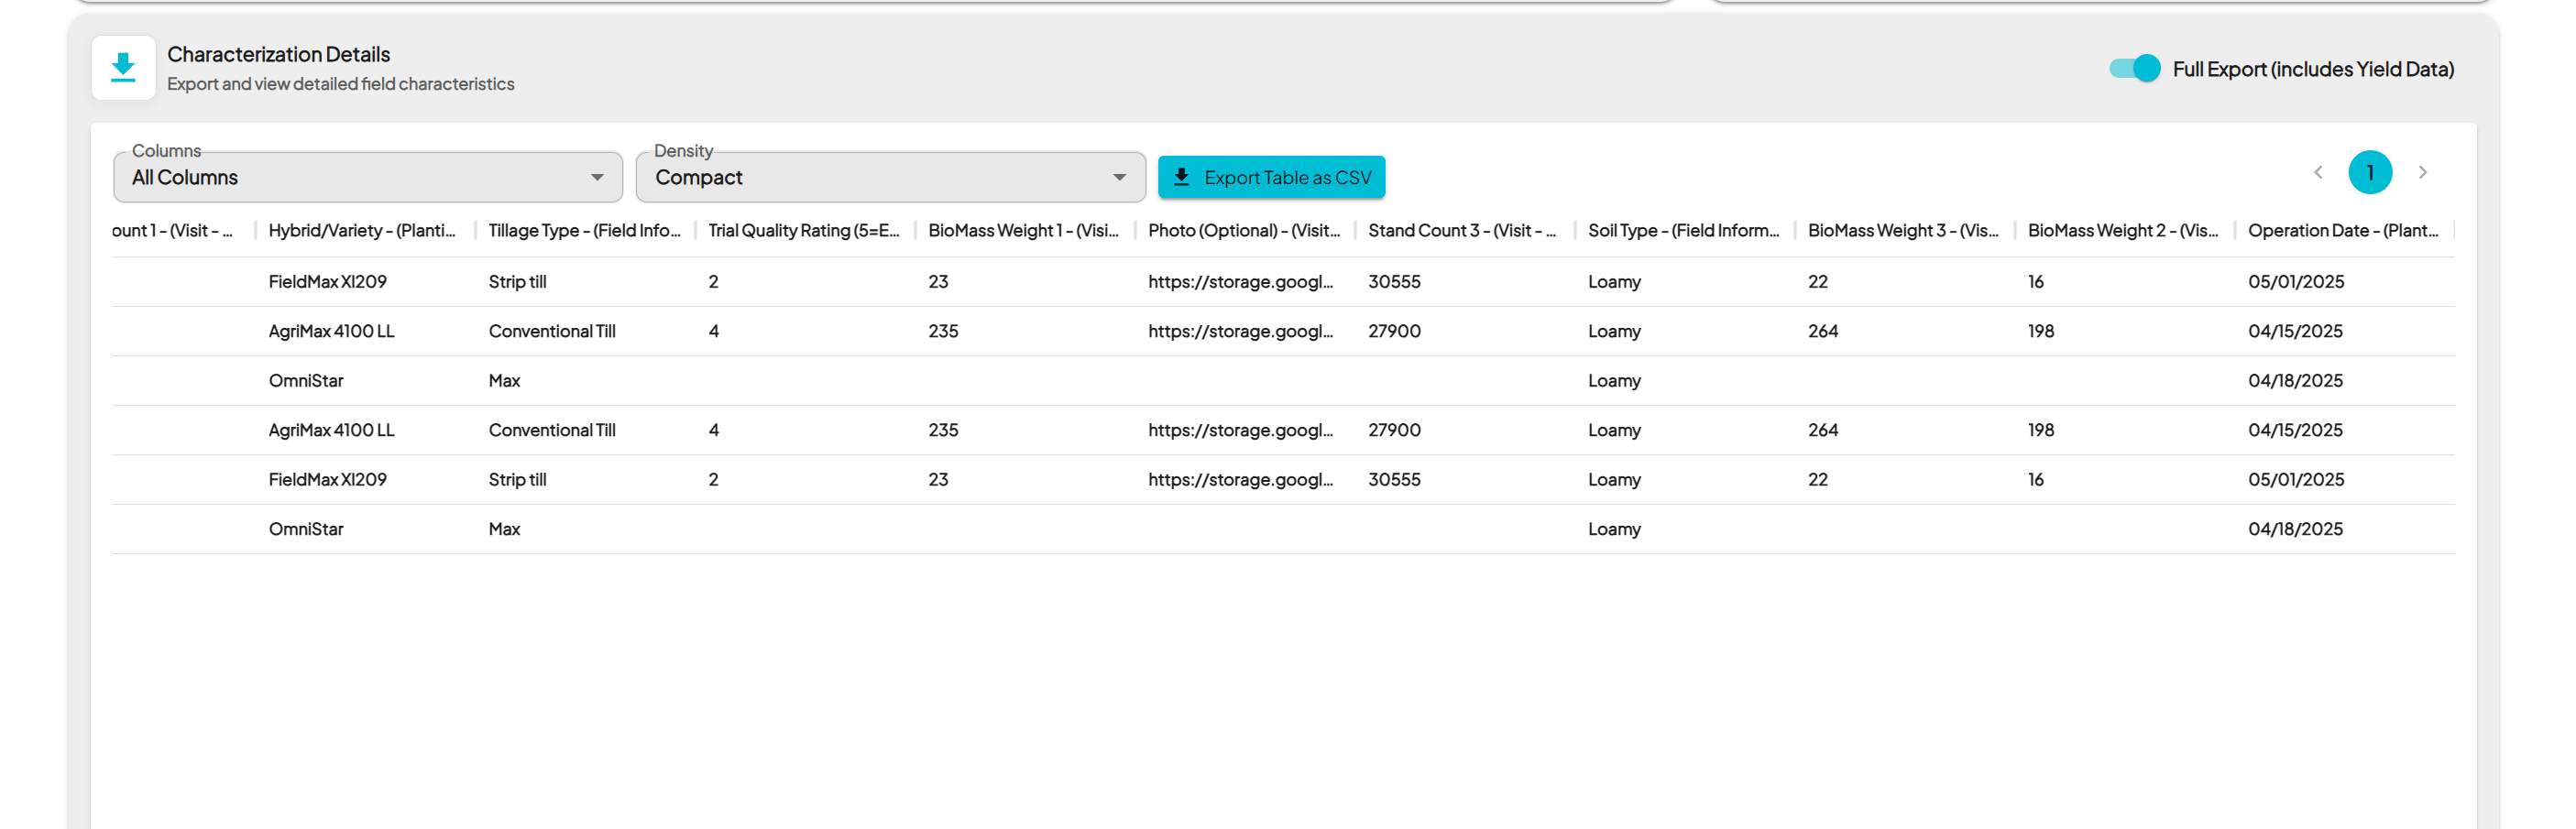
Yield and characteristics data now live in the same workspace. This design gives operations and agronomy teams the flexibility to answer both performance and practice questions all within a single view.
Practical Use Cases
- Compare trial outcomes between irrigated and dryland fields.
- Track how different hybrids or prior crops influence yield or stand establishment.
- Aggregate field visit observations to evaluate consistency across territories.
- Review planting and harvest timing patterns across growers or regions.
Example: Loamy Fields in Midwest with their Product Performance
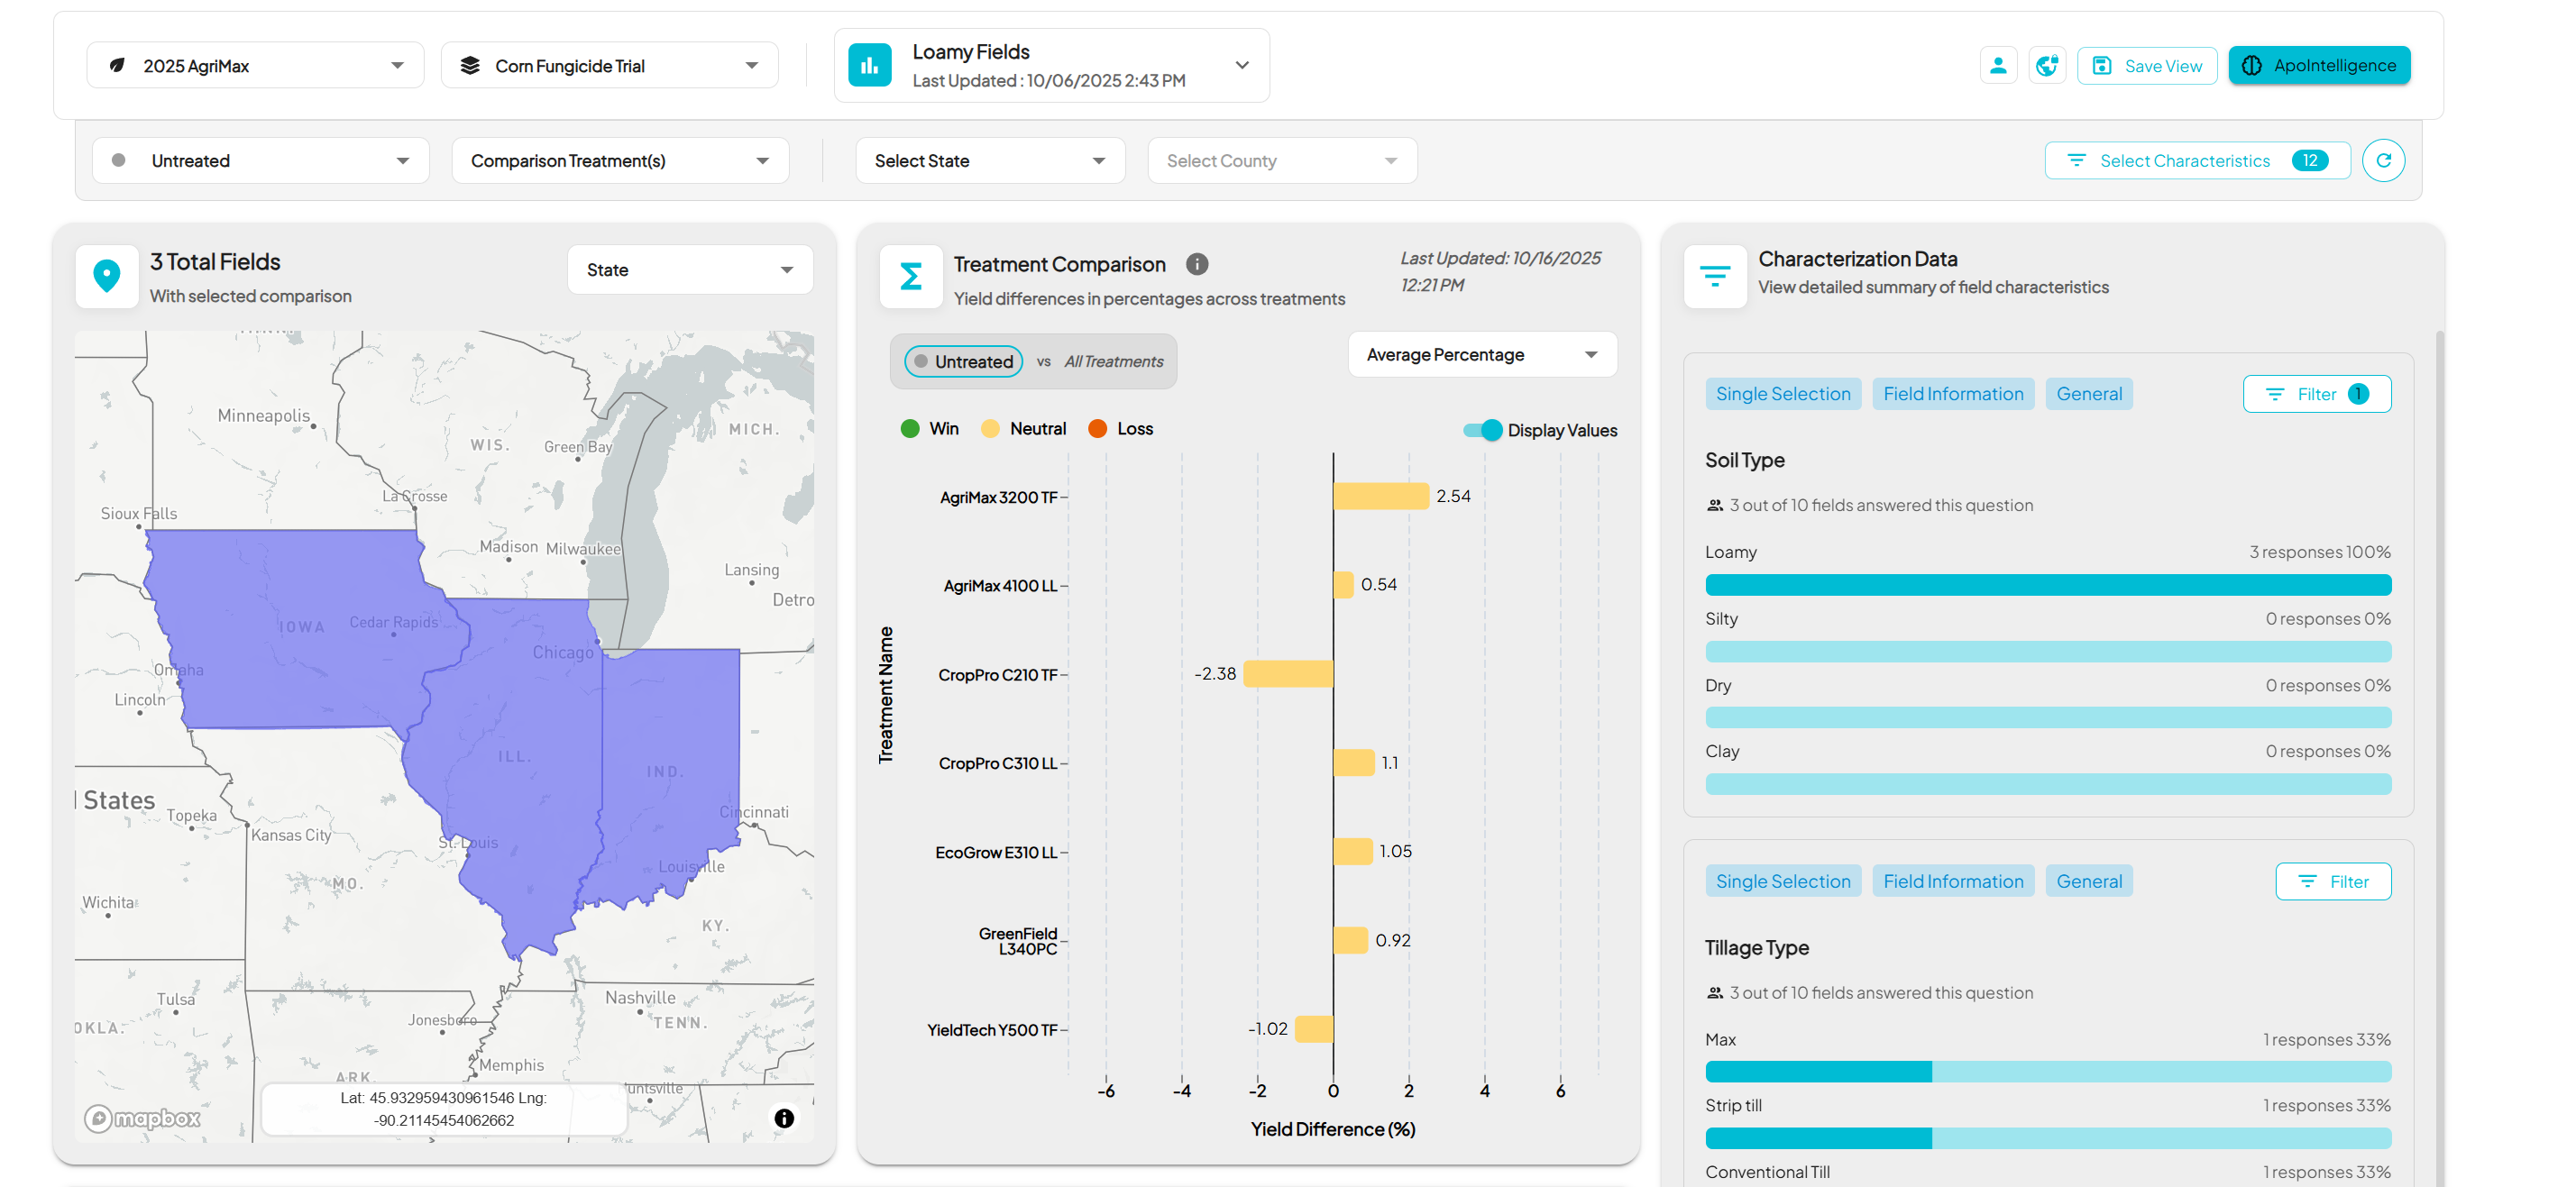
Everything that used to require a custom dashboard or export can now be analyzed interactively inside Insights.
2. INSIGHTS | Views – Save, Share, and Reuse
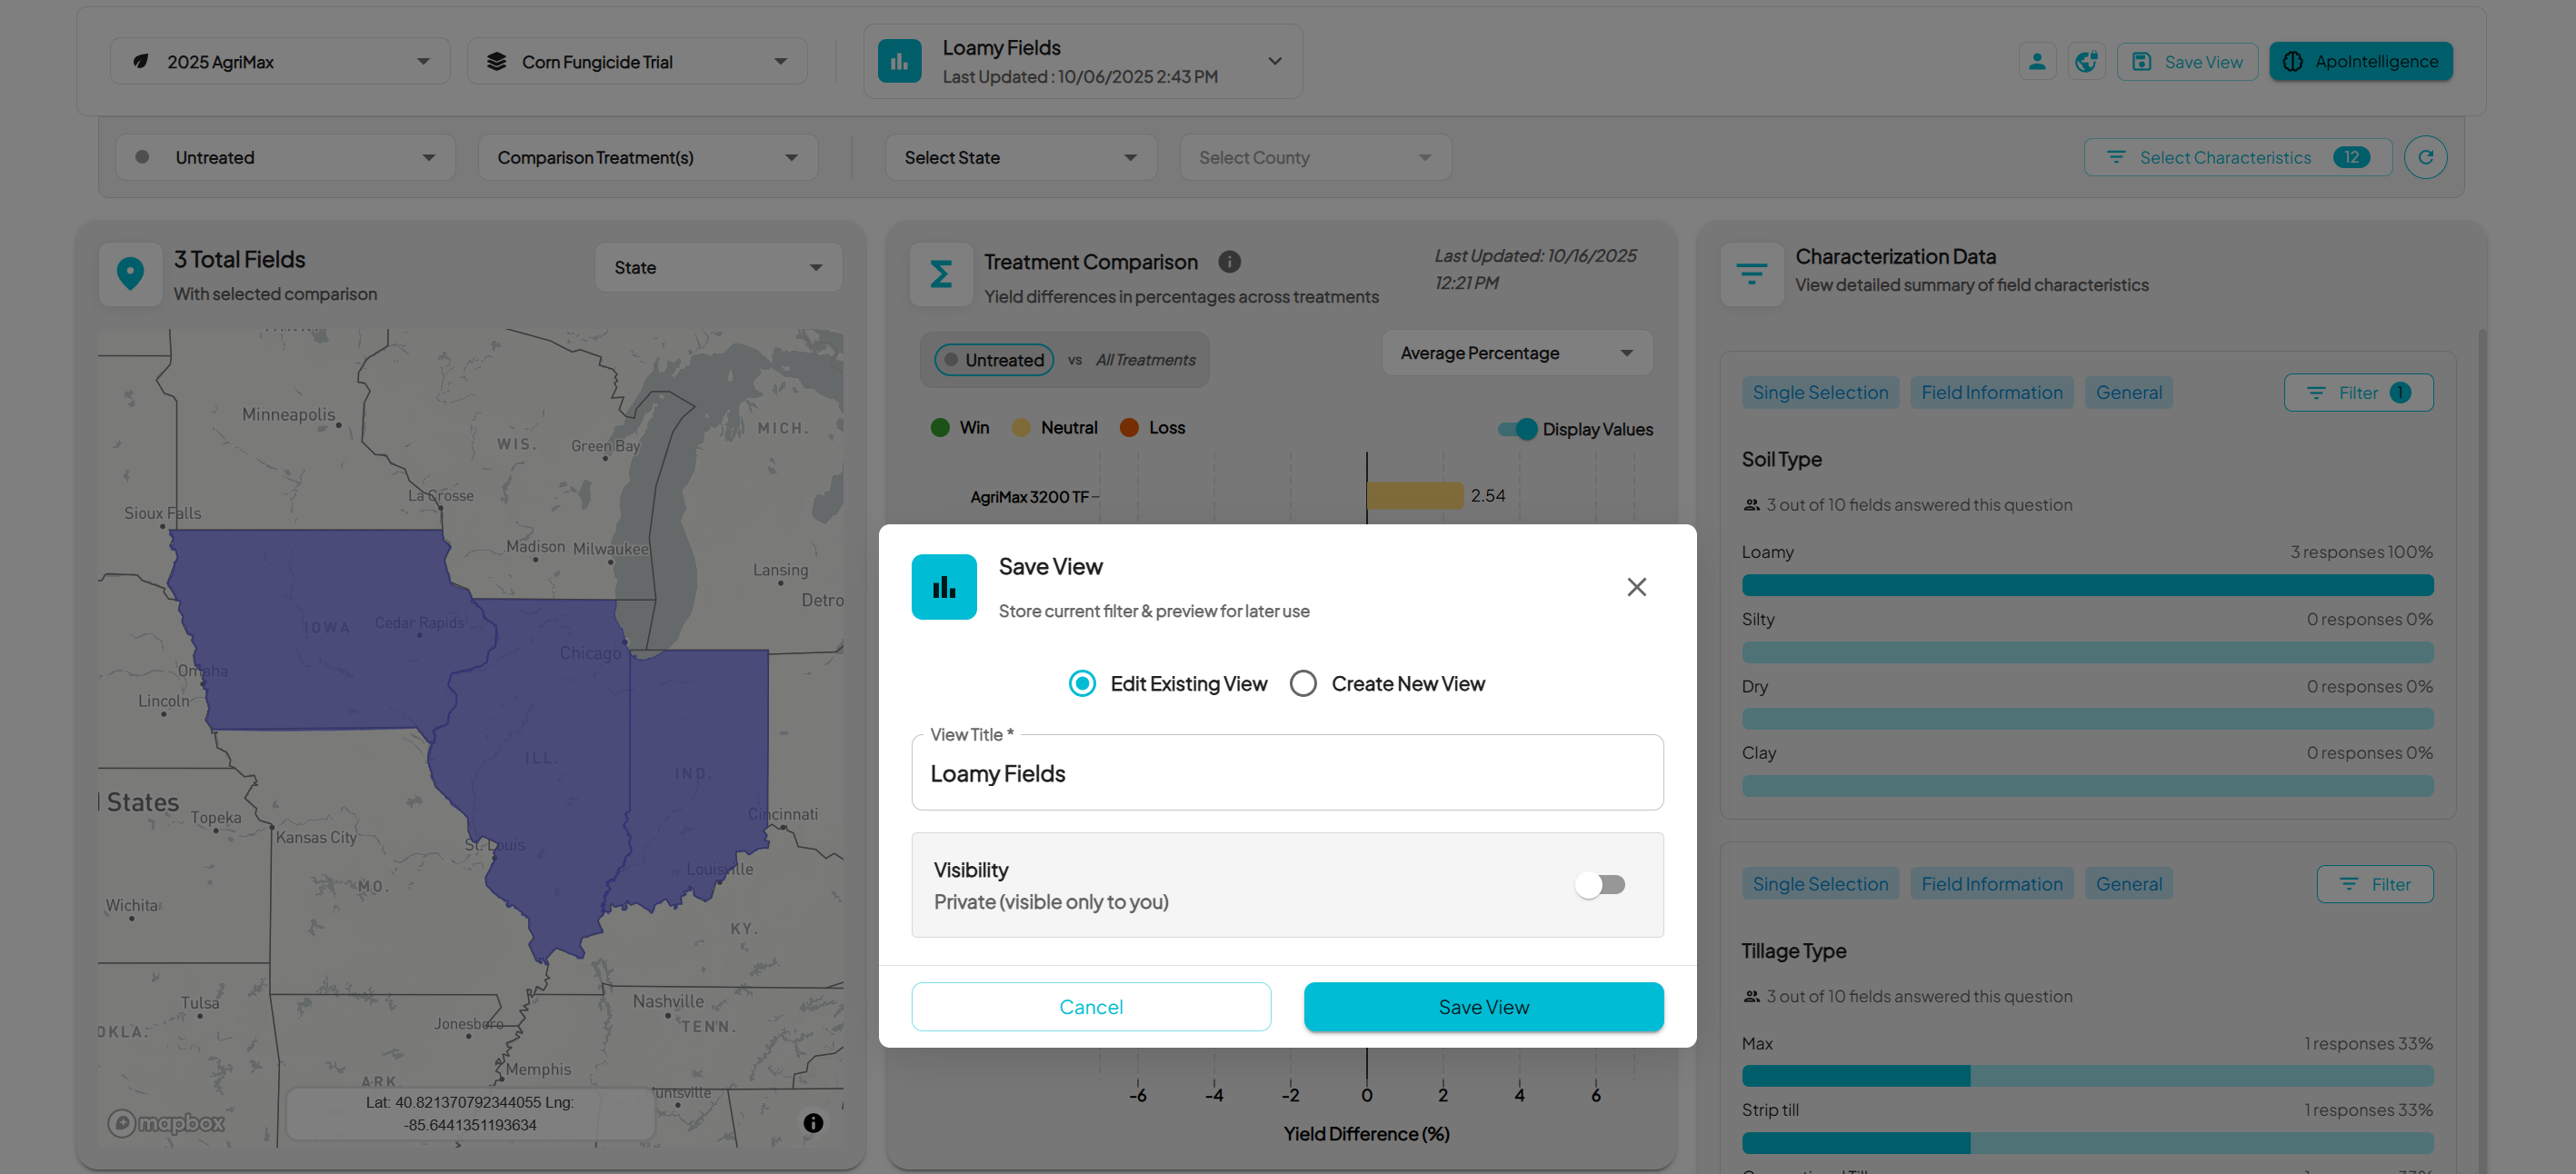
The new Views framework introduces configurability and collaboration inside Insights. Users can now build their own analysis experience, save it, and return to it anytime without reselecting filters or reconfiguring charts.
Views remember exactly how data was filtered, what characteristics were selected, and how charts were displayed. This allows each user to personalize their workflow while maintaining consistency across teams.
Teams can now:
- Save custom setups as Named Views to revisit later.
- Share Views across the organization to ensure consistent reporting and analysis.
This makes Insights more than a visualization tool it becomes a configurable workspace that adapts to how different users explore data.
For a detailed walkthrough on how to load characteristics, filter data types, and create or share Views, see the Insights How-To Guide This guide covers every step from selecting characteristics to saving and managing public or private Views.
Learning Insights
Outside Insights, v3.12.0 also delivers several platform-wide enhancements:
GIS Workstation and Machine Data:
- MyJohnDeere Shapefile Optimization: Improved handling and down-sampling for large harvest shapefiles to prevent timeouts.
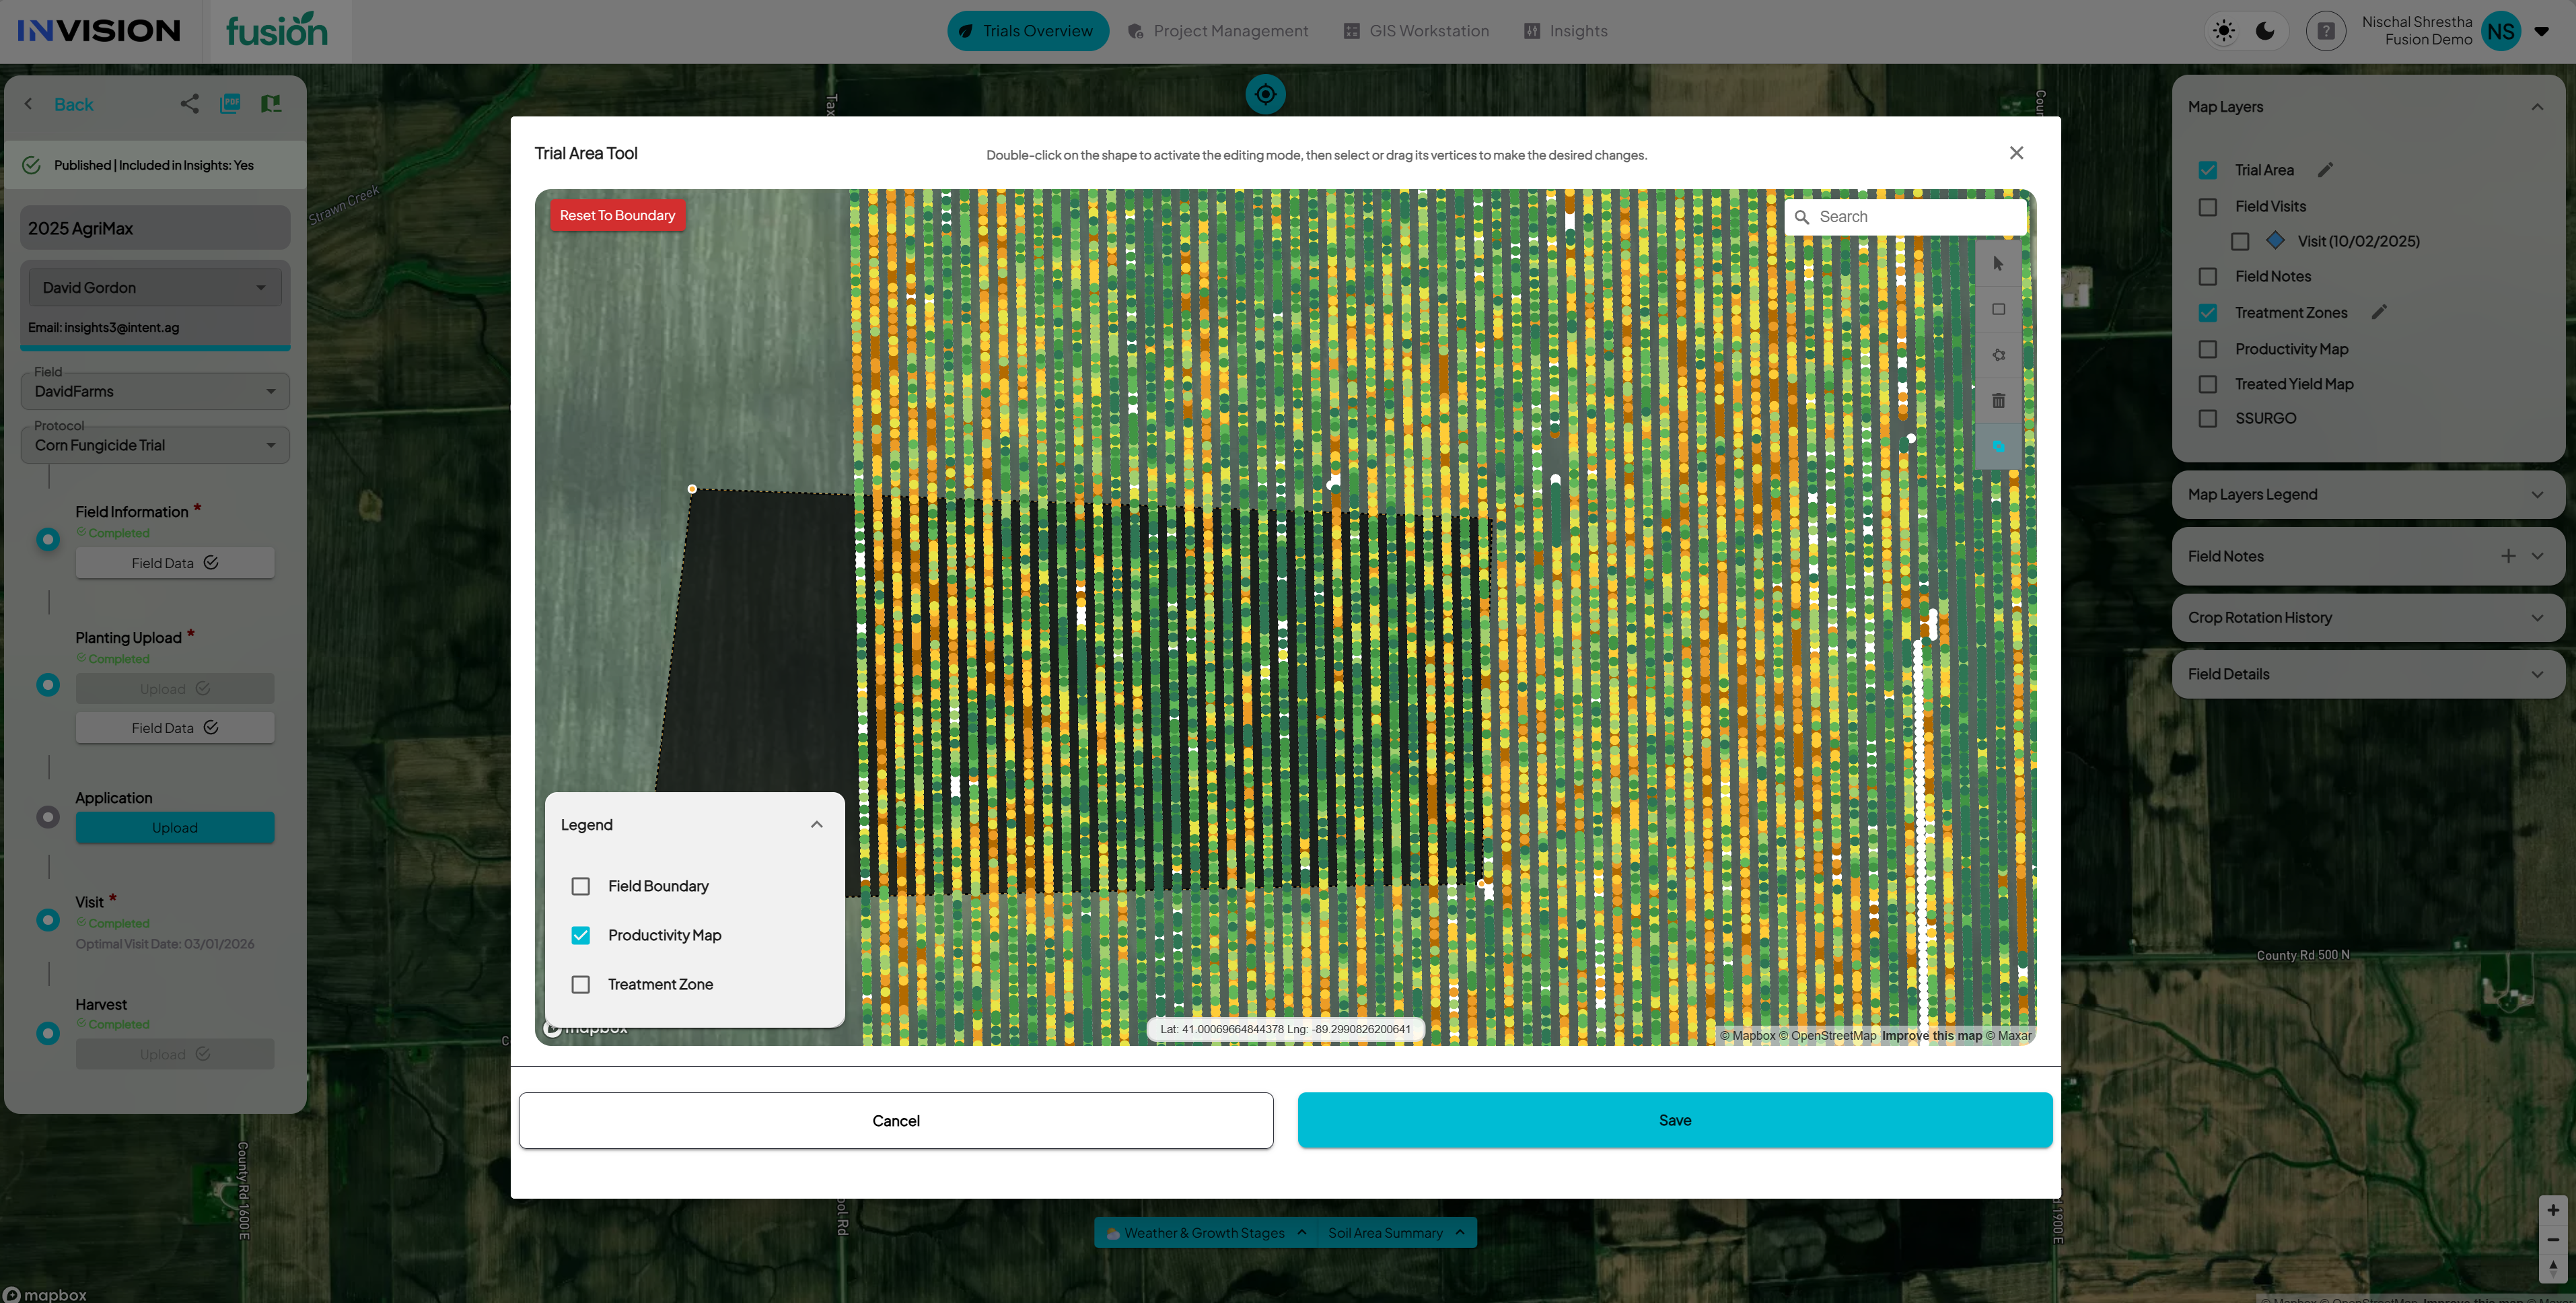
- Trial Area with Productivity Map: Added the Trial Area productivity view inside the View Fields workspace for easier harvest processing.

- Download Zone from GIS Workstation: Added an option to download treatment zones shapefiles from the GIS Workstation screen.
- Geometry Validation (Satellite Imagery Ordering): Fixed polygon geometry issues that previously blocked Planet imagery requests.
Operational Enhancements:
- Client Admin Edit User Details: Client Admins can now edit user first name, last name, and mobile number directly in the Admin panel.
- Treatment Zone Edit Stability: Fixed a bug causing treatment details to drop when editing products within a zone.
- Field Notes Layer (Mobile): Field Notes can now be displayed as a selectable map layer inside the mobile app.
- SSURGO Layer (Mobile): Fixed an issue preventing the SSURGO soil layer from displaying in mobile maps.
- Mobile Reliability (Mobile): Improved data sync, map rendering, and offline performance during field visits.