Learning Insights
Introduction
Historically, Insights has been built around yield data which is valuable, but limiting for those collecting broader on-farm information.
Each season, INVISION captures a large amount of structured data from trials. This includes products, management practices, soil types, planting and harvest dates, field visits, and performance results. Insights organizes and aggregates that data so it can be compared, summarized, and visualized for better decision-making. This type of information is called characteristics data.
Characteristic Data
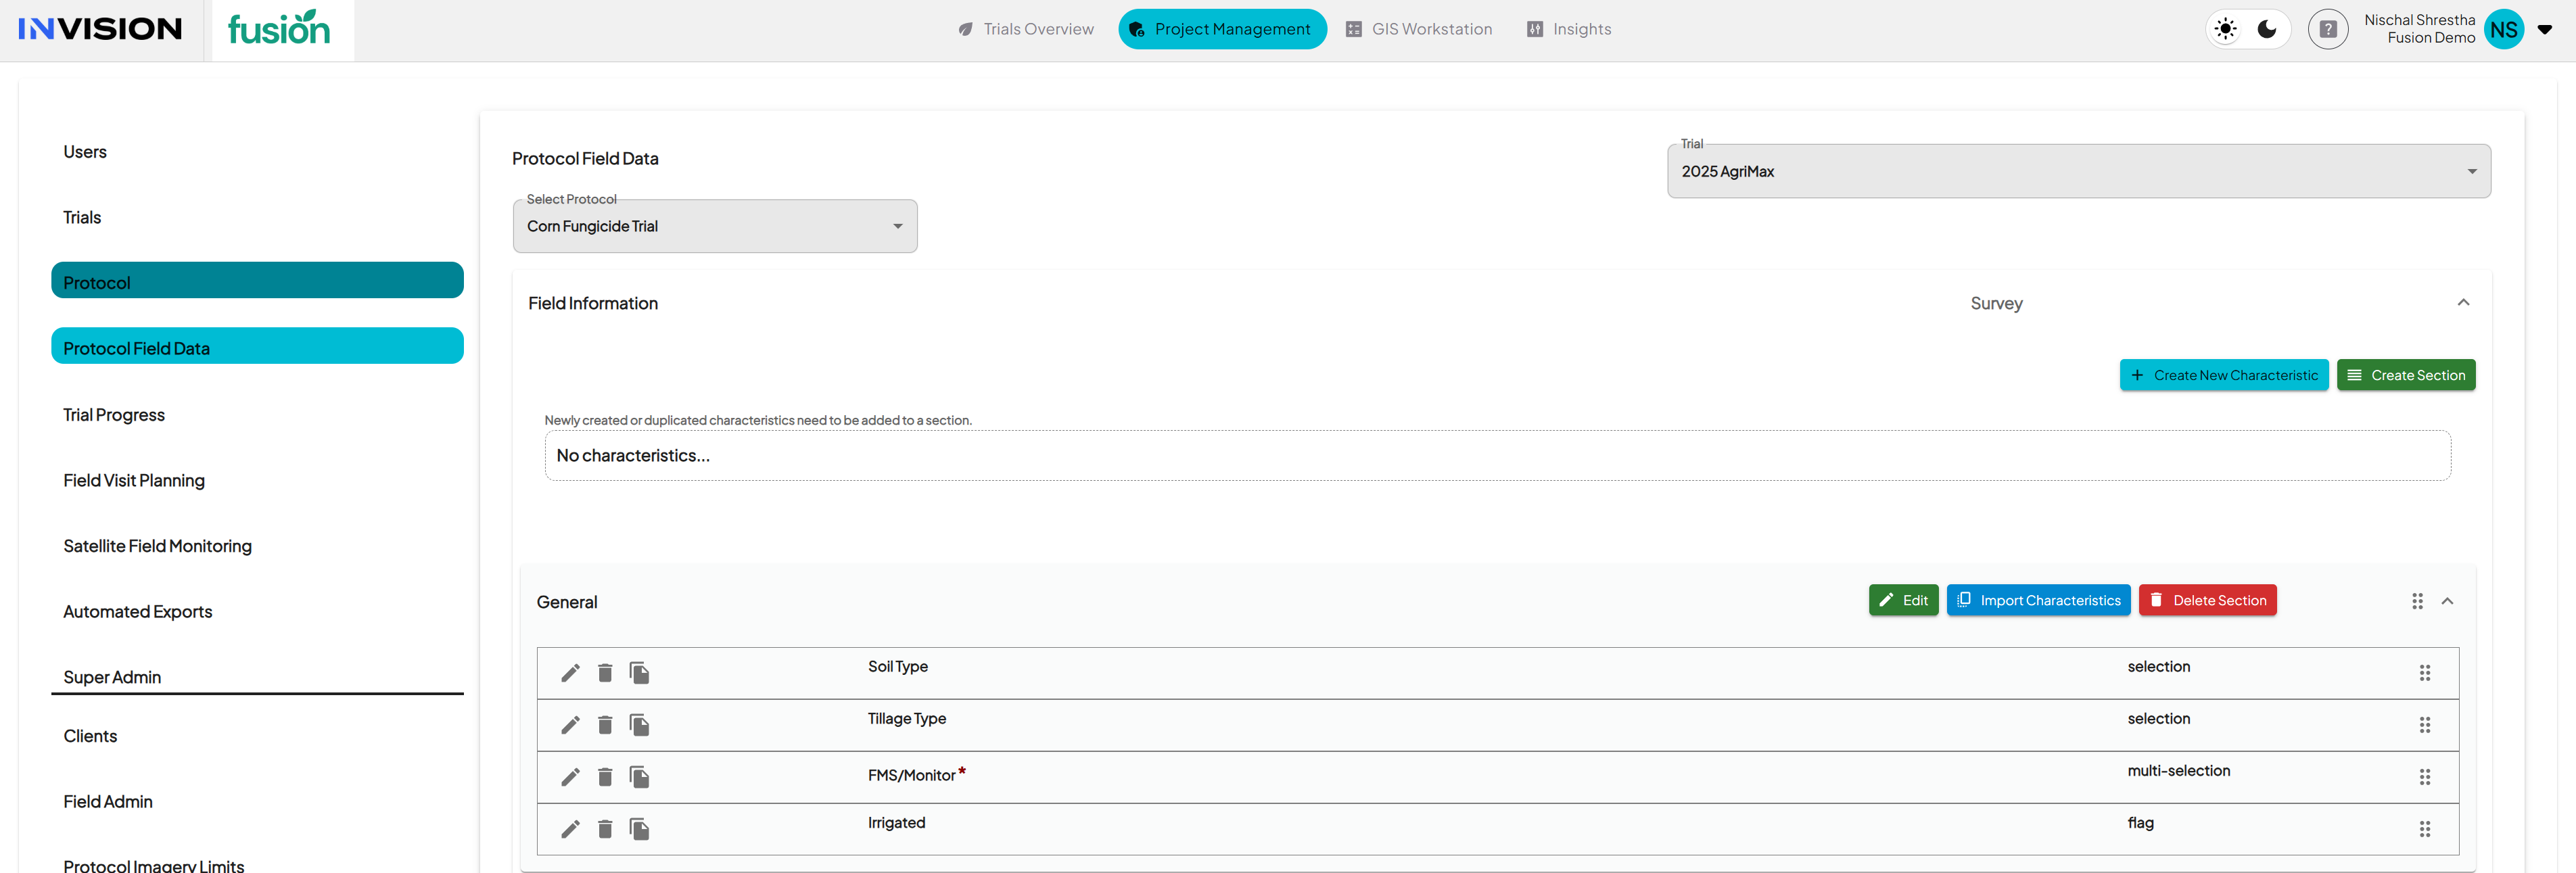
- Characteristic data refers to all non-yield information collected throughout the season.
- It includes what is captured during field visits, surveys, and setup steps inside each project.
- These values describe how the field was managed, what conditions it experienced, and what was observed during the season.
- Examples include:
- Field Information: soil type, tillage system, irrigation, soil CEC, and management practices.
- Planting Details: hybrid or variety, planting date, and prior crop.
- Field Visits: stand counts, biomass weights, trial quality ratings, comments, or photos.
- Once these are configured and collected in a project, they automatically appear inside Insights as aggregated, filterable data.
- Users can combine these attributes with yield results to understand patterns, compare management approaches, and evaluate product performance under different field conditions.
Views
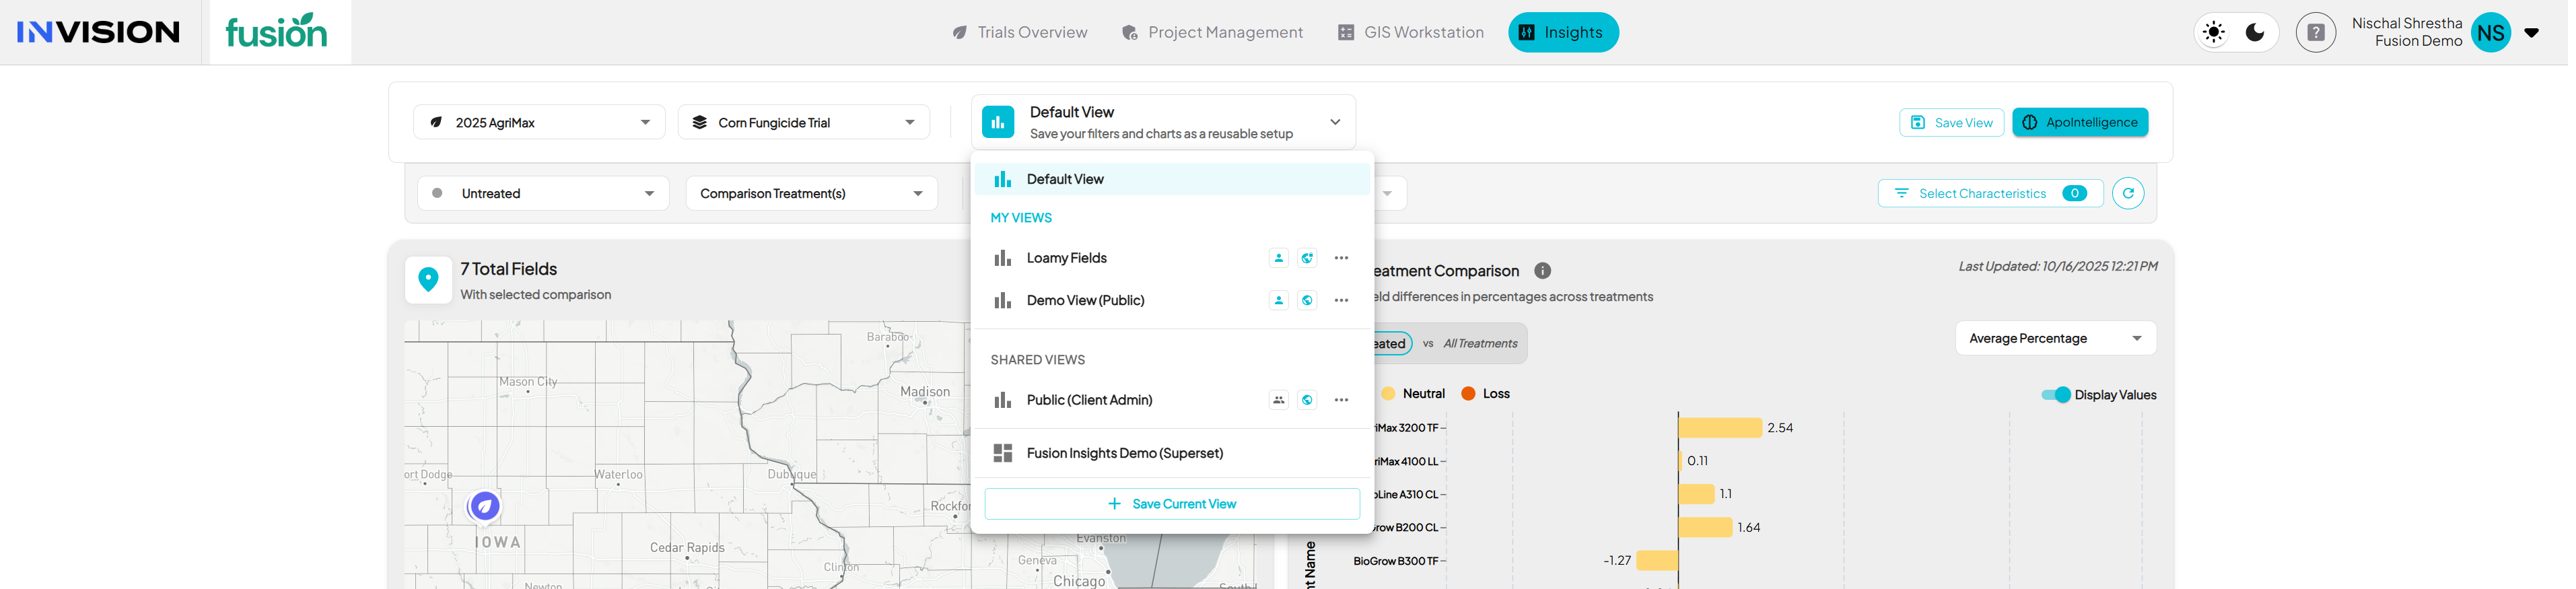
- A View saves the entire configuration of your current Insights session.
- Each View remembers what protocol you selected, what treatments were compared, which filters and characteristics were applied, and how charts were displayed.
- Views can be created, updated, and shared so that users do not need to rebuild the same setup every time.
- There are two visibility options when saving a View:
- Private: visible only to the person who created it.
- Public: visible to all users who have access to Insights under the same client account.
- Views make it easier for teams to maintain consistency across analysis and reporting, ensuring everyone is looking at the same dataset and configuration.
- They also allow quick switching between saved setups for different comparisons, such as region-based, treatment-based, or management-based analyses.
Walkthrough: Insights
1. Go to Insights
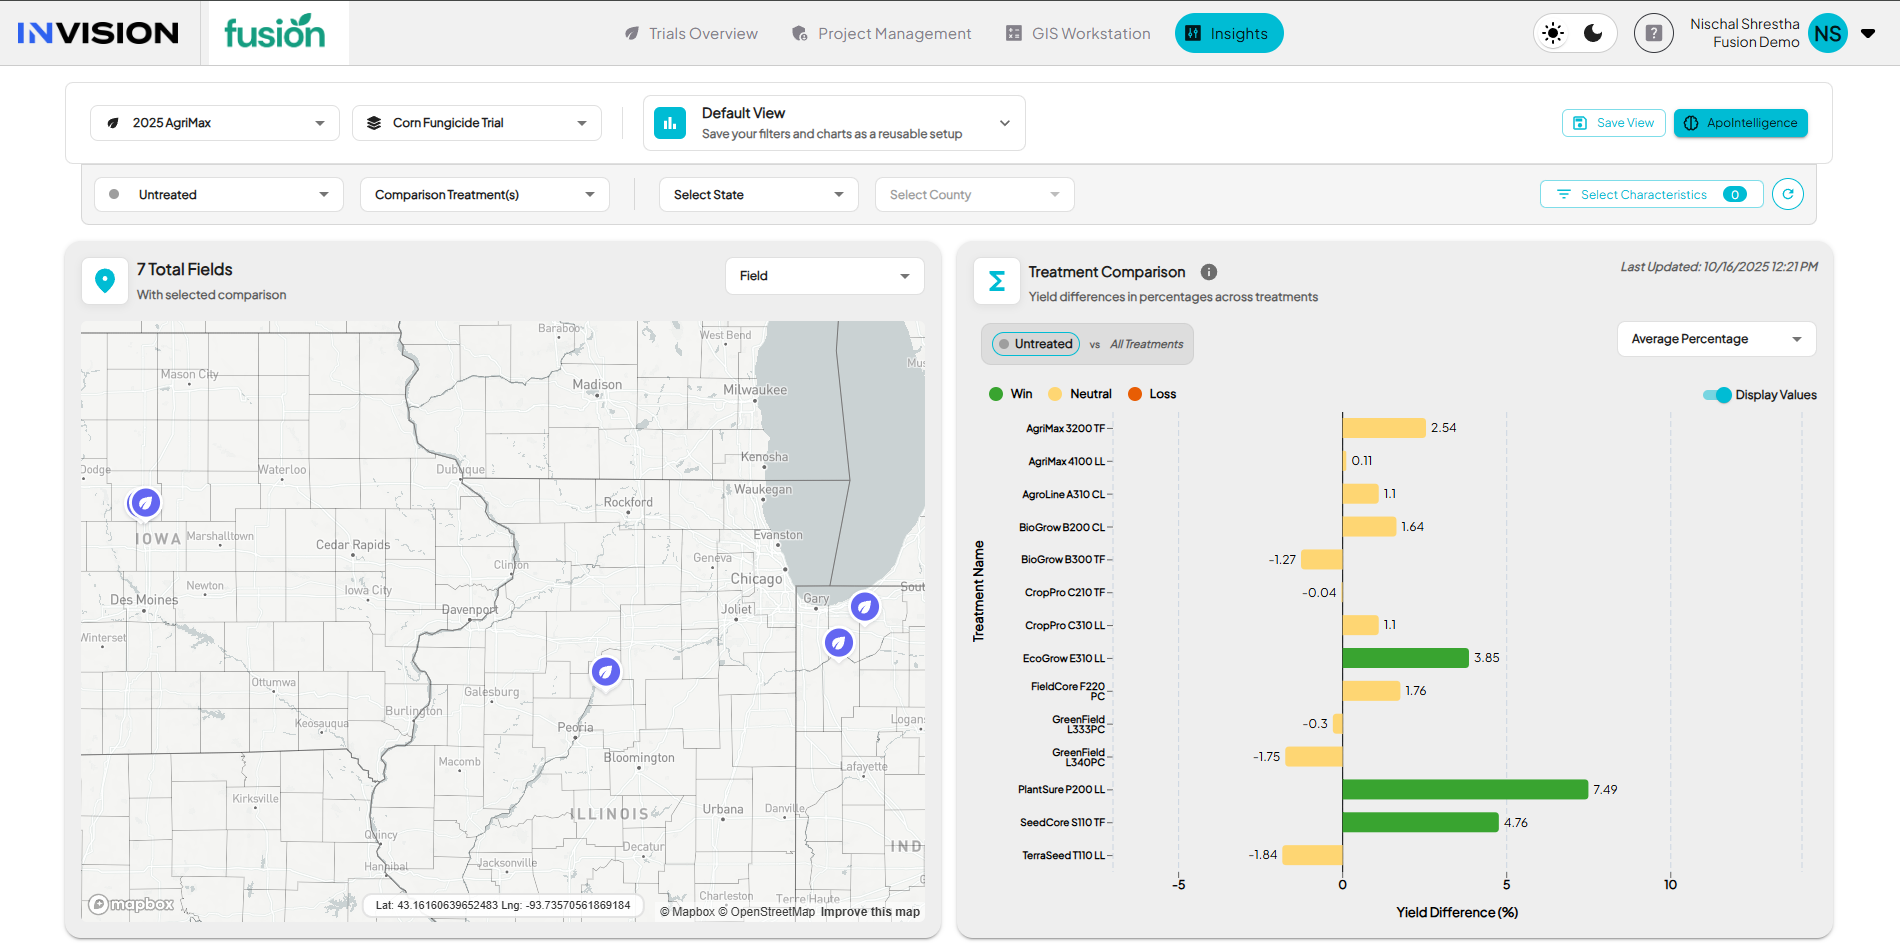
- When you open Insights, your active trial automatically loads based on the project you are working in.
- The default view displays your map, Treatment Comparison, Yield by Field Comparison, and the Select Characteristics button on the right.
- In the top bar, you will see two dropdowns:
- Trial is your trial selector.
- Protocol is your protocol selector.
- The page will also default to your Primary Treatment, showing it as selected automatically.
- You can add Secondary Treatments (multi select) if you want a comparison.
- Optional geography filters are available to narrow the map and charts:
- State
- County
- Province (for Canada)
Once this context is set, you can begin exploring or filtering the characteristics data.
2. Select Characteristics
The Select Characteristics button is where you decide what data to bring into your Insights workspace. It defines what you can analyze across fields, treatments, and management practices.
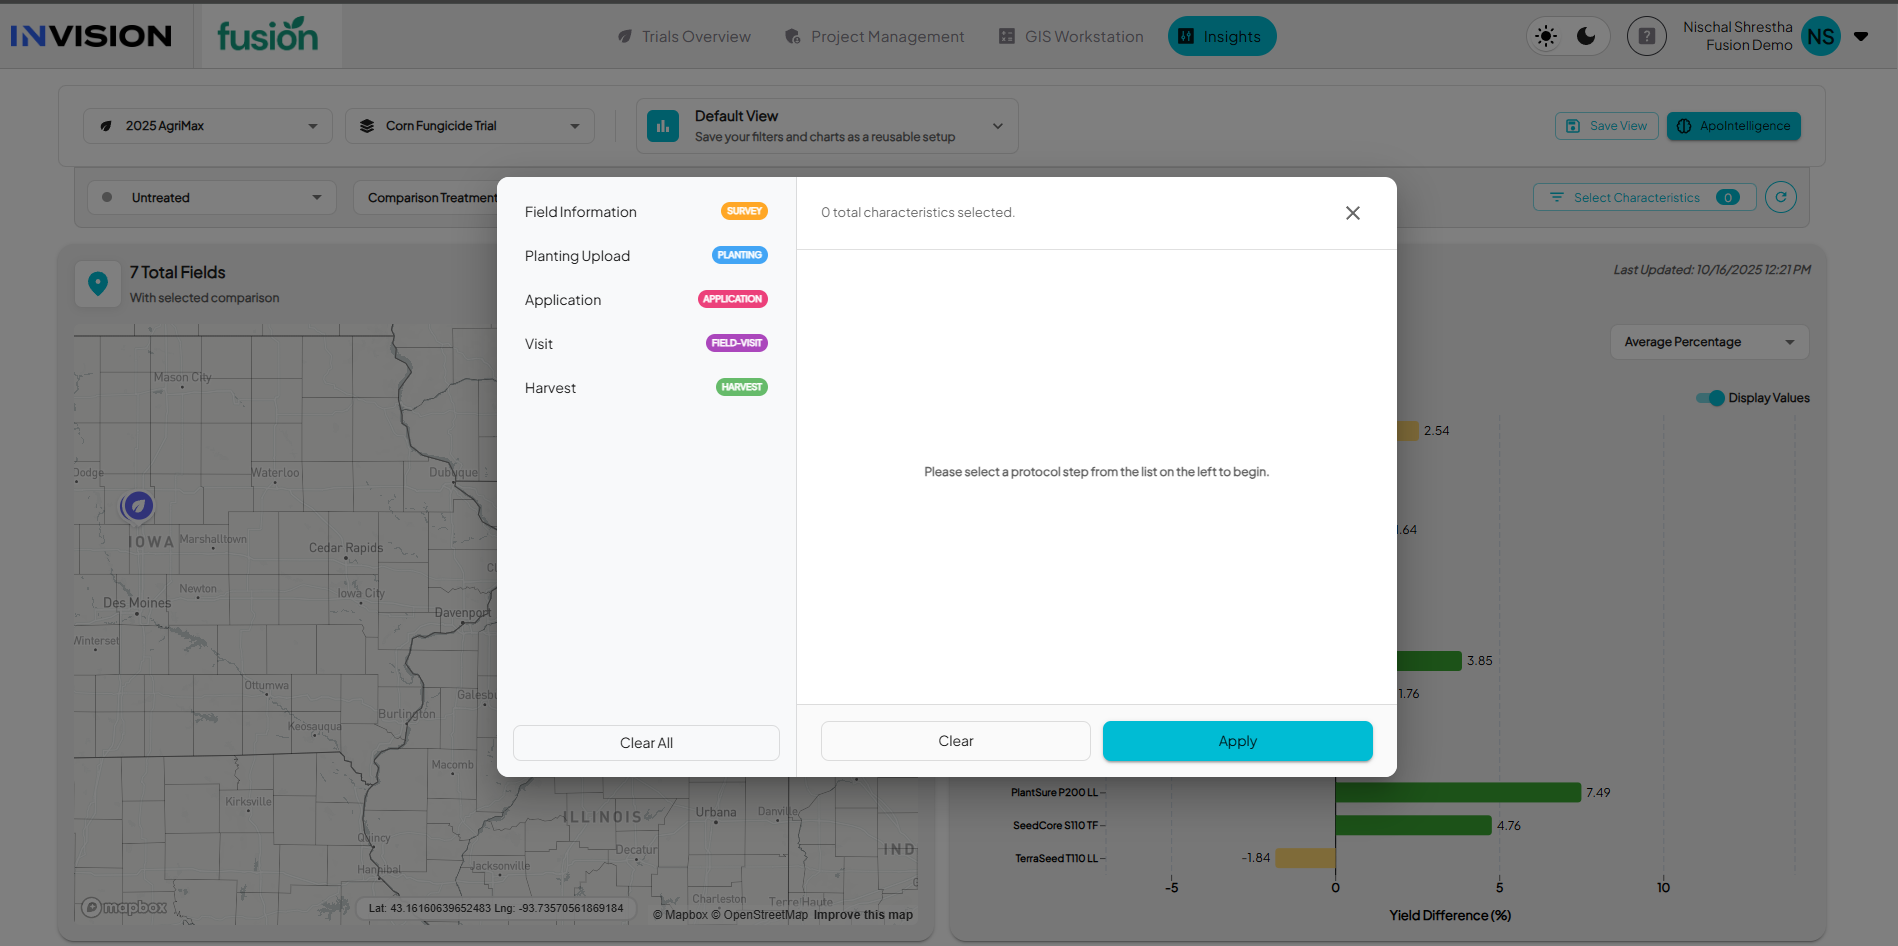
- Click Select Characteristics in the top-right corner of the page.
- A panel opens showing protocol steps on the left. Each step represents a stage in the season where data was collected:
- Field Information – grower setup details and field-level information
- Planting Upload – planting information and equipment data
- Application – input or treatment details applied to the field
- Visit – field observations or measurements collected during the season
- Harvest – harvest and yield details

- Once you select a step, you’ll see sections and the characteristics inside it. Each characteristic appears with its data type, such as Selection, Multi-Selection, Integer, Decimal, Flag, Text, Upload, or Date.
- Review the list and check the characteristics you want to load. You can select one or multiple from any step.
- Click Apply when you’re done.
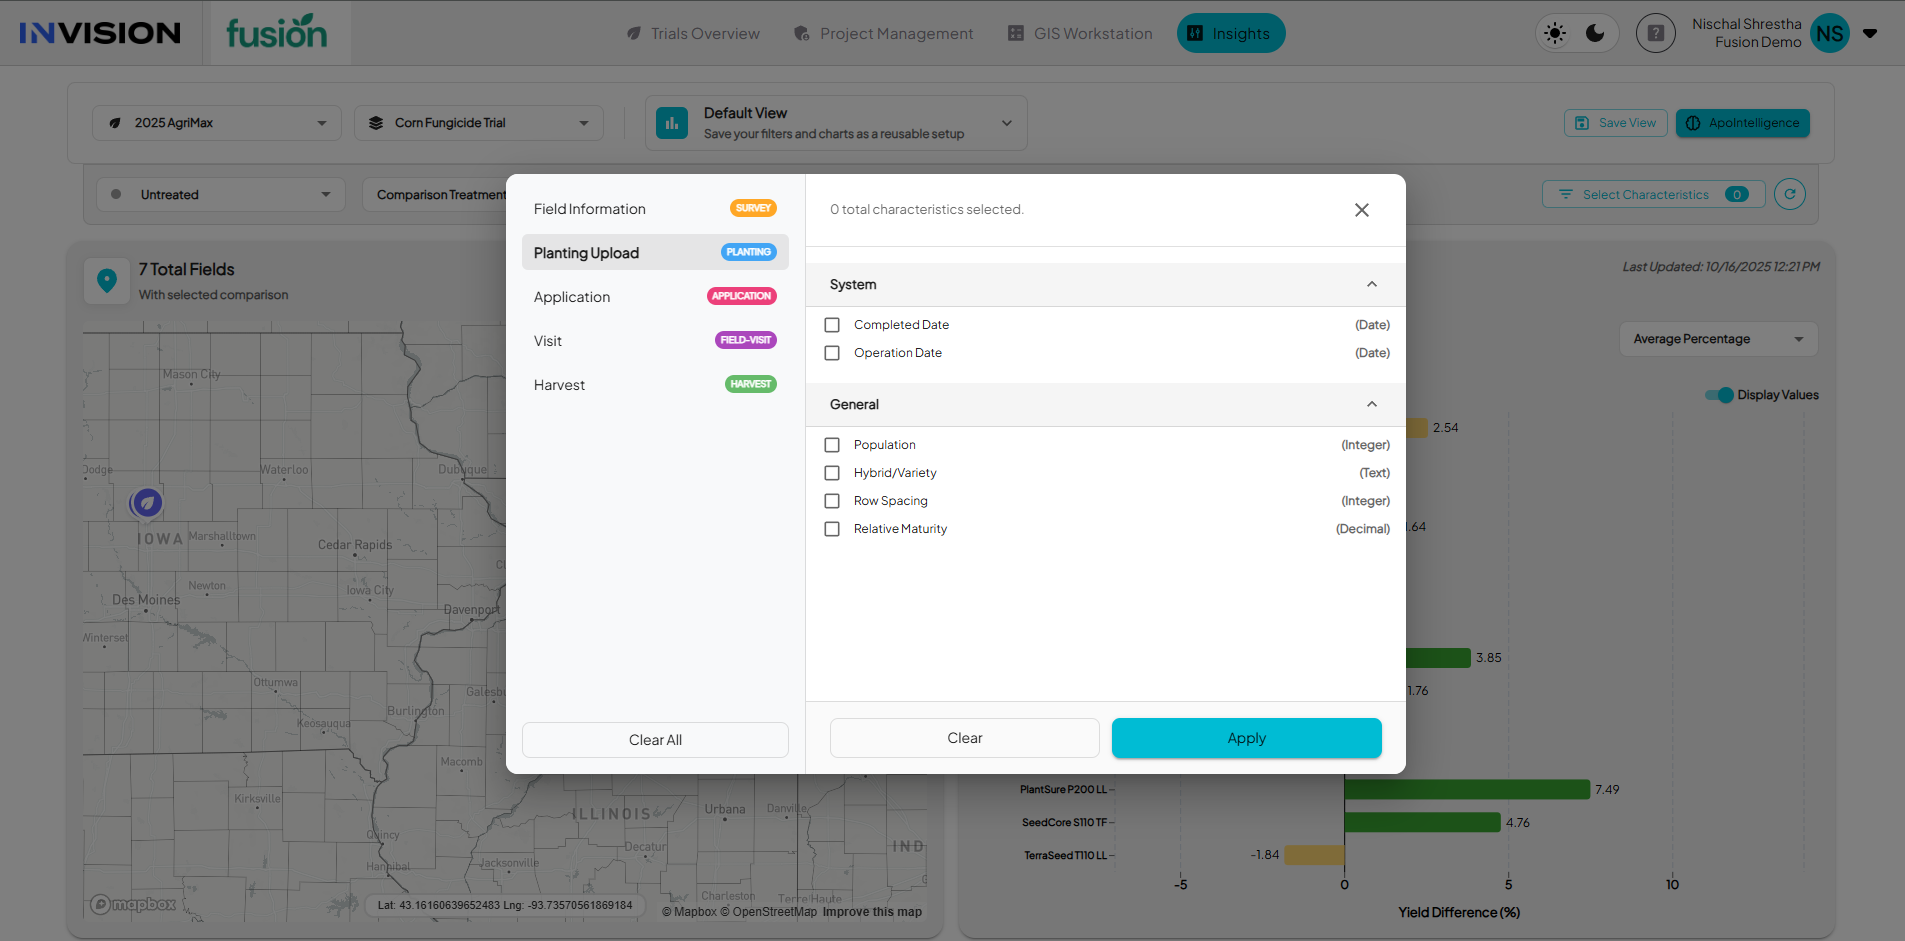
Insights will then:
- Load those characteristics into the Characterization Data panel on the right.
- Display them in an aggregated format so you can quickly see distributions, counts, or averages.
- Automatically link them to the yield and treatment charts on the left meaning any filter you apply here also filters your yield analysis.
For example, if you filter Soil Type = Loamy, every chart and field shown in Insights will update to include only Loamy fields.
3. Filter by Data Type
Once characteristics are loaded, the Characterization Data panel on the right displays all selected characteristics grouped by their data type.
Each data type behaves slightly differently and offers its own visualization and filtering options.
Selection and Multi-Selection
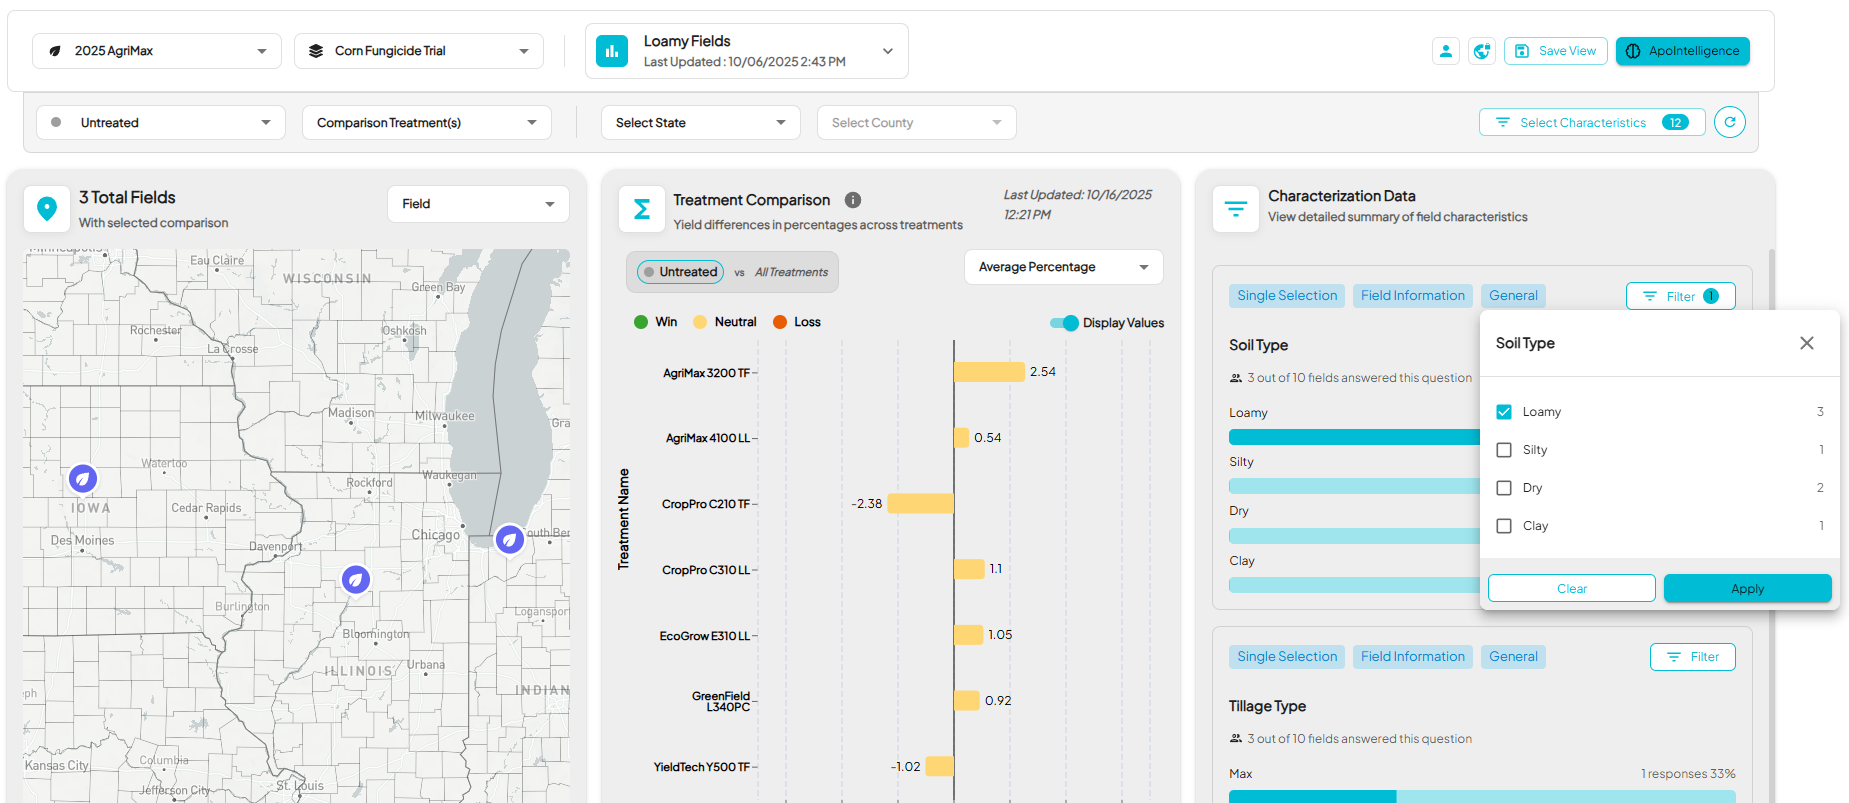
- Displays a bar chart showing how many fields answered each option.
- You can filter by selecting one or multiple values directly from the chart or from the filter dropdown.
- Example: Select No-till under Tillage Type to view only fields using that system.
Flag (Boolean)
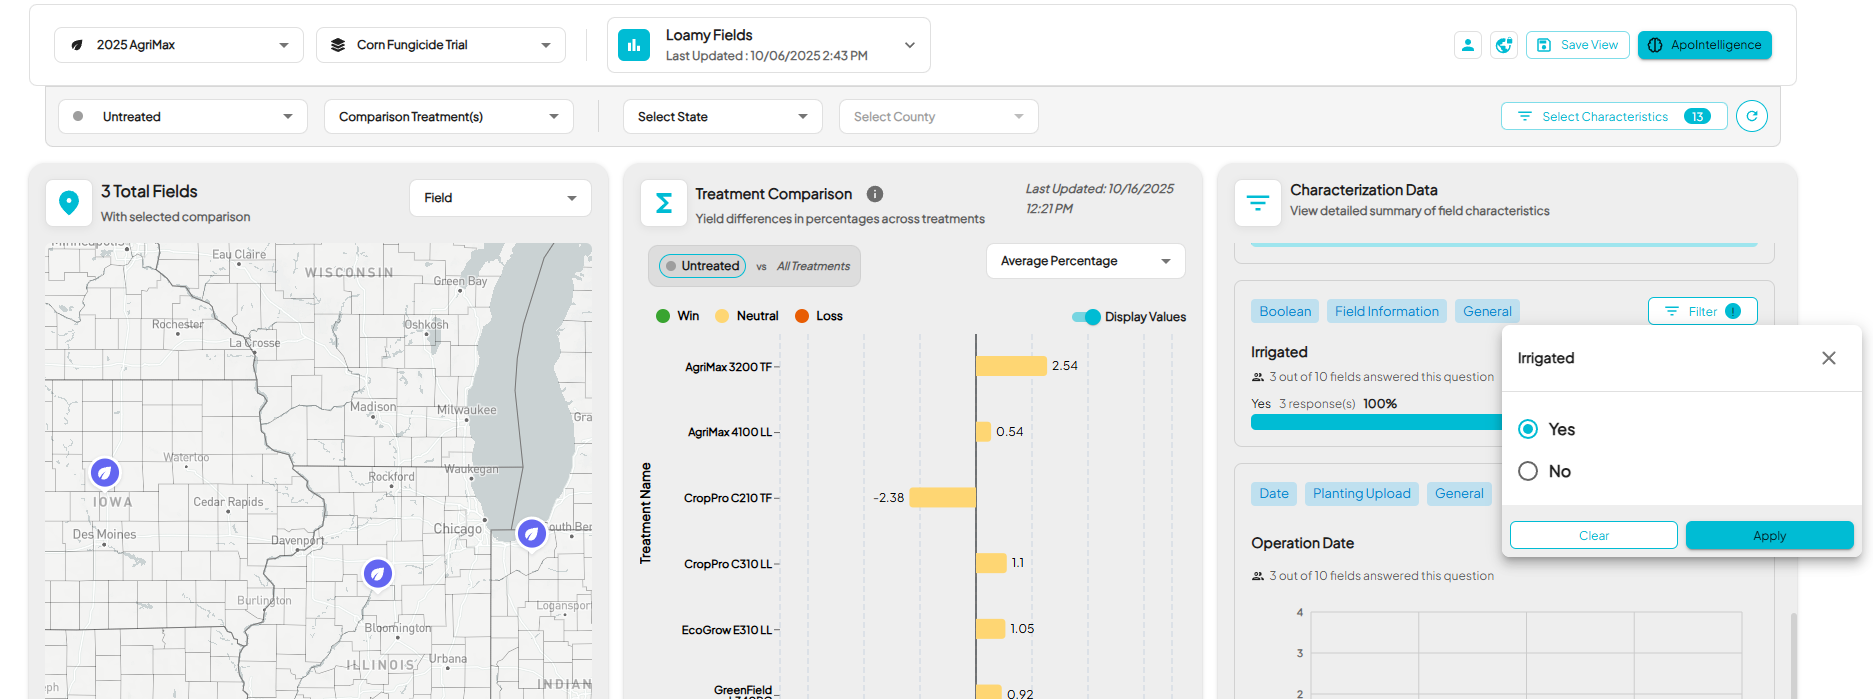
- Shows a a bar view (Yes vs No) with response counts and percentages.
- Click Yes or No to instantly filter all charts to that subset.
- Example: Choose Yes under Irrigated to view only irrigated fields.
Integer / Decimal
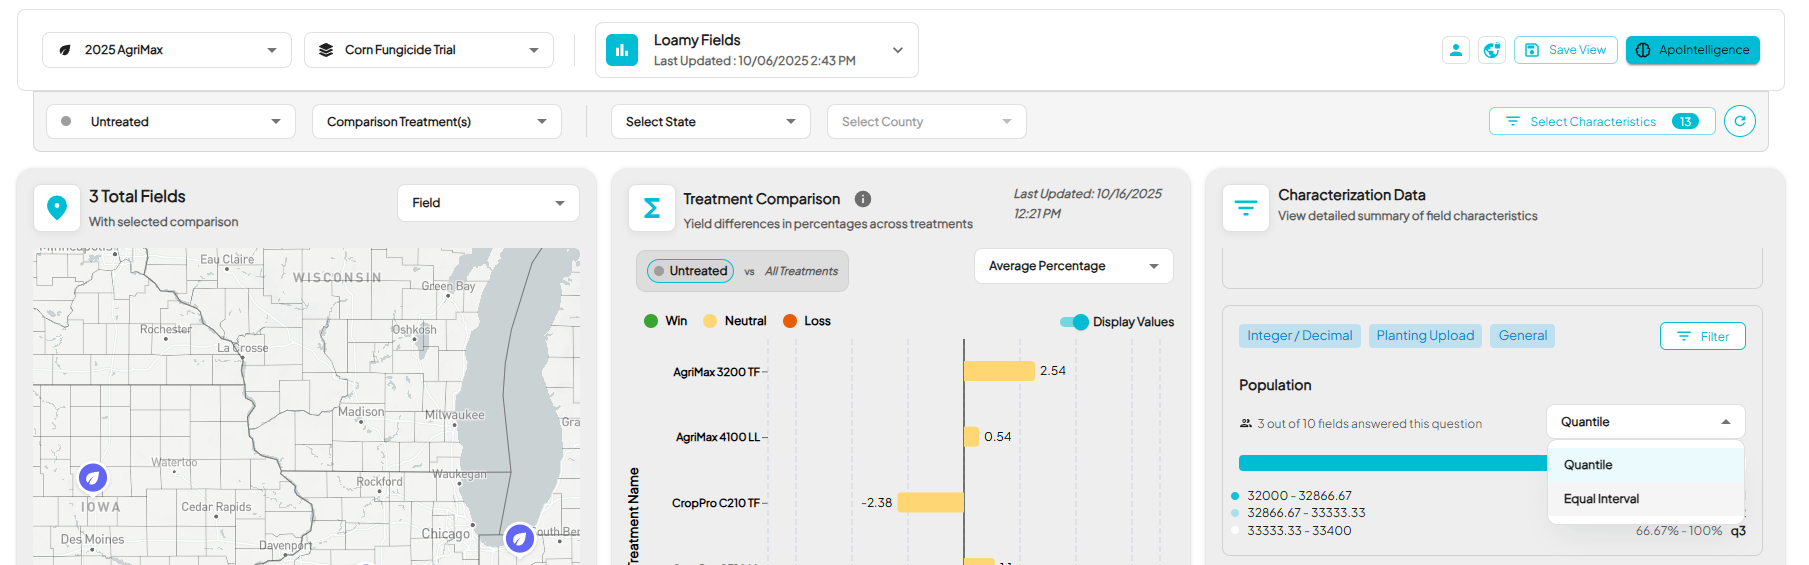
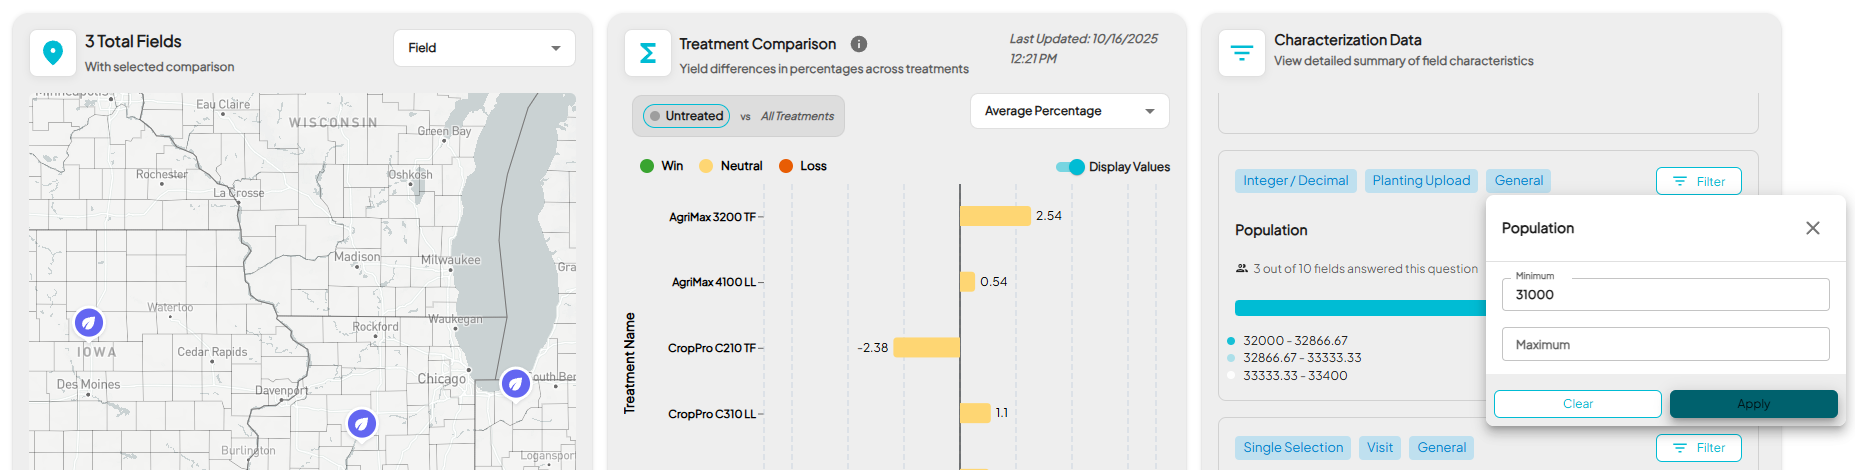
- Displays a distribution chart showing the numeric spread across all fields.
- You can toggle between Quantile or Equal Interval views to adjust how the data is grouped.
- Use the Min and Max fields to filter a specific numeric range.
- Example: Filter Population between 31,000–33,000 to isolate fields within that range.
Text
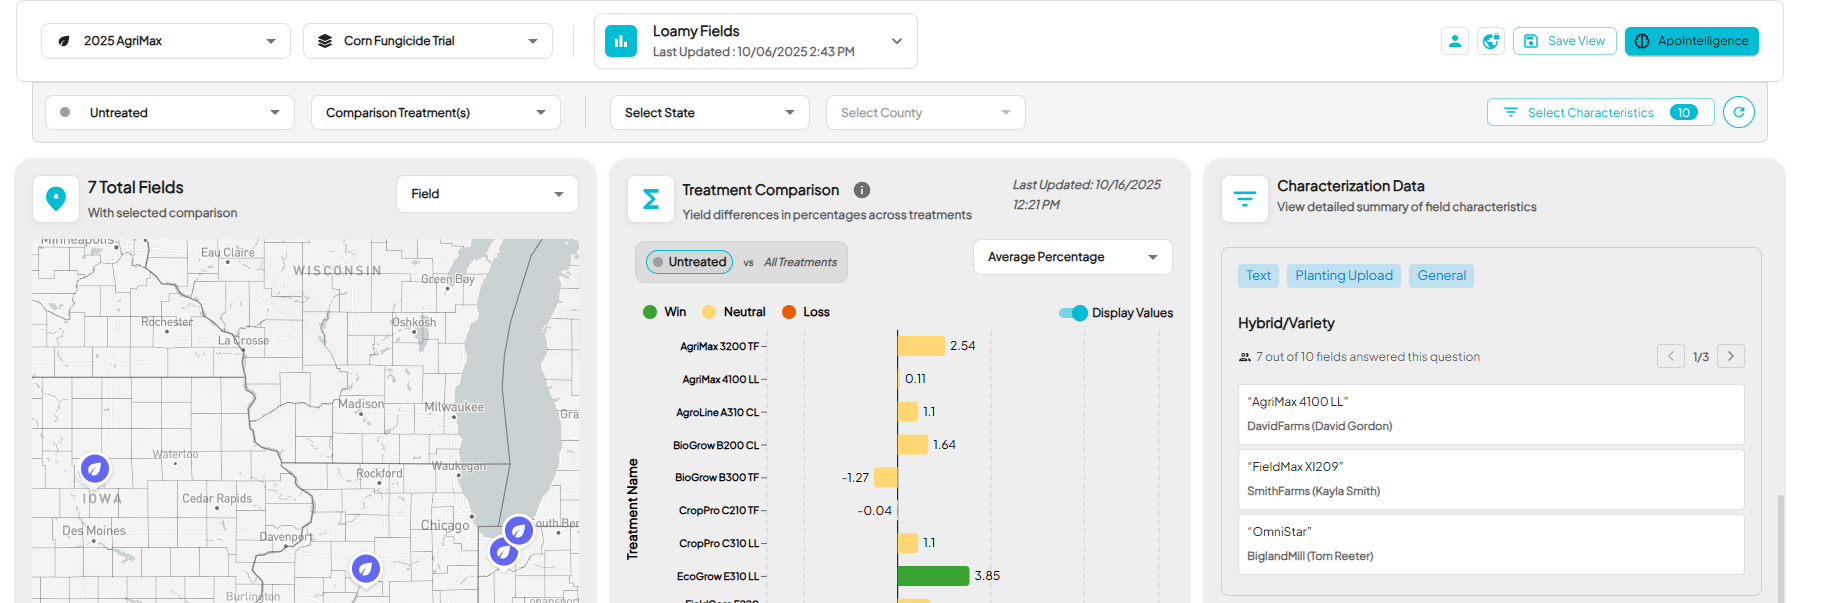
- Shows all unique answers per field in a scrollable list format.
- Ideal for freeform questions like comments, hybrid names, or notes.
- This view is for review only and text fields cannot be filtered.
Upload
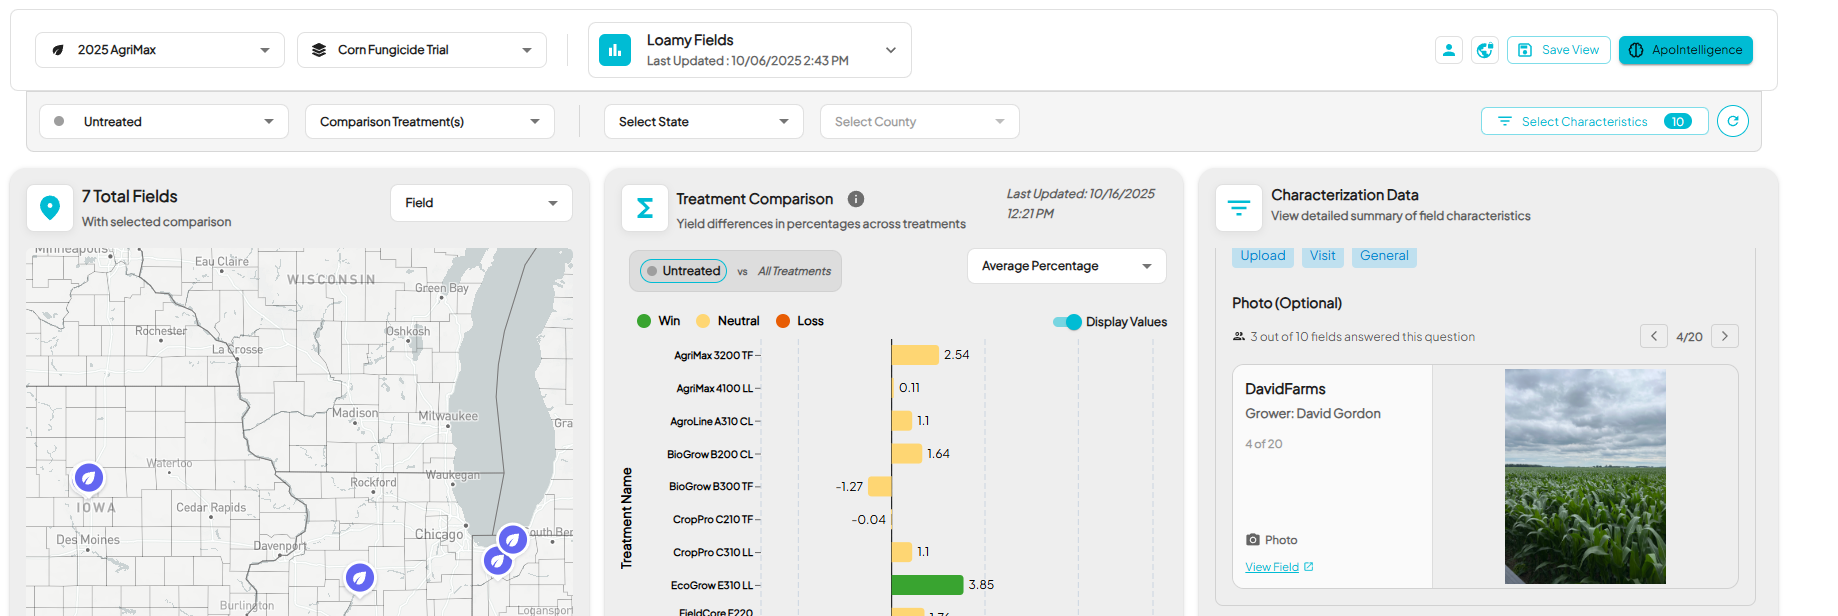
- Displays a carousel of photos uploaded during field visits or surveys.
- You can click on View Field link to open the corresponding field directly.
- Useful for visually verifying field conditions or validation photos.
Every filter you apply in the Characterization Data panel dynamically updates all yield and treatment charts in real time, keeping your entire analysis in sync.
4. Create and Save a View
Once you’ve configured your Insights workspace, selected your trial, treatments, filters, and characteristics then you can save that setup as a View.
Views allow you to return to the same analysis later without having to rebuild it.
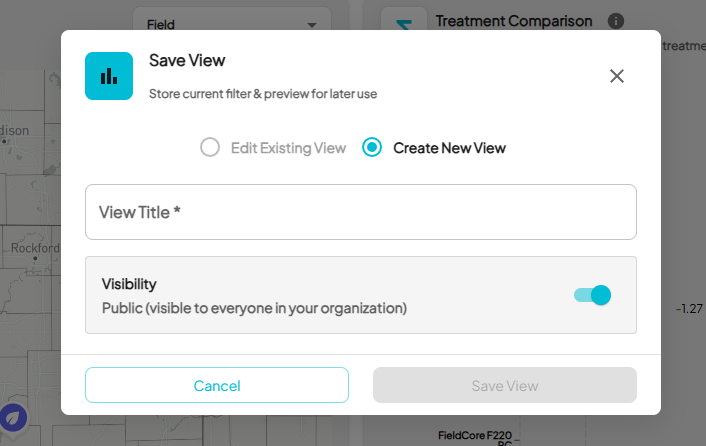
How to Create a View
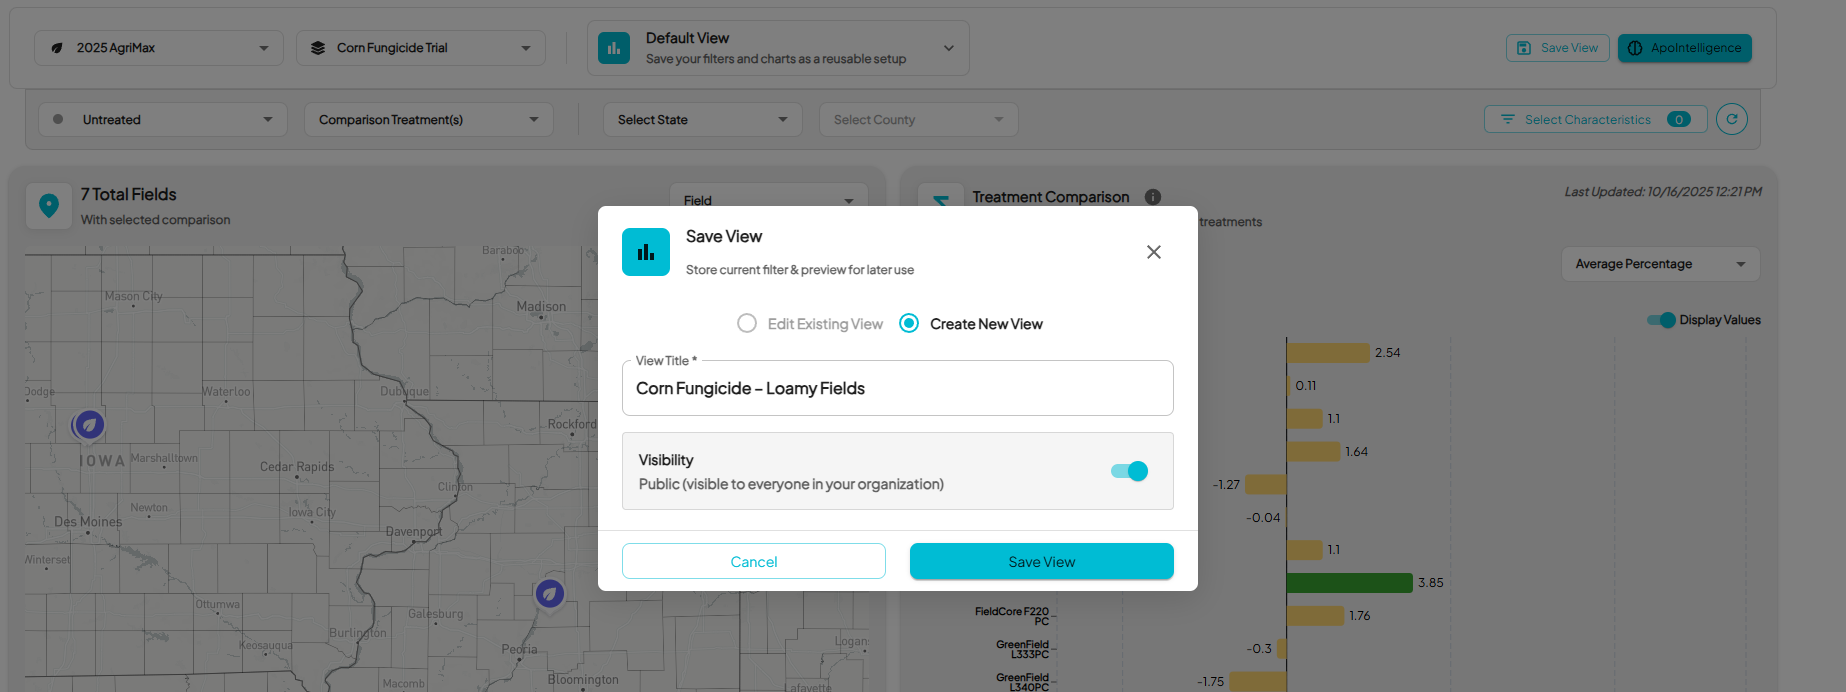
- Click Save View at the top right of the page.
- Choose Create New View.
- Enter a descriptive View Title: for example, “Corn Fungicide – Loamy Fields” .
- Under Visibility, decide who can access it:
- Private: Only you can see and use this view.
- Public: Anyone within your client organization who has access to Insights can see and use it.
- Click Save View.
Your new view now appears in the View Selector at the top of the page.
How to Edit an Existing View
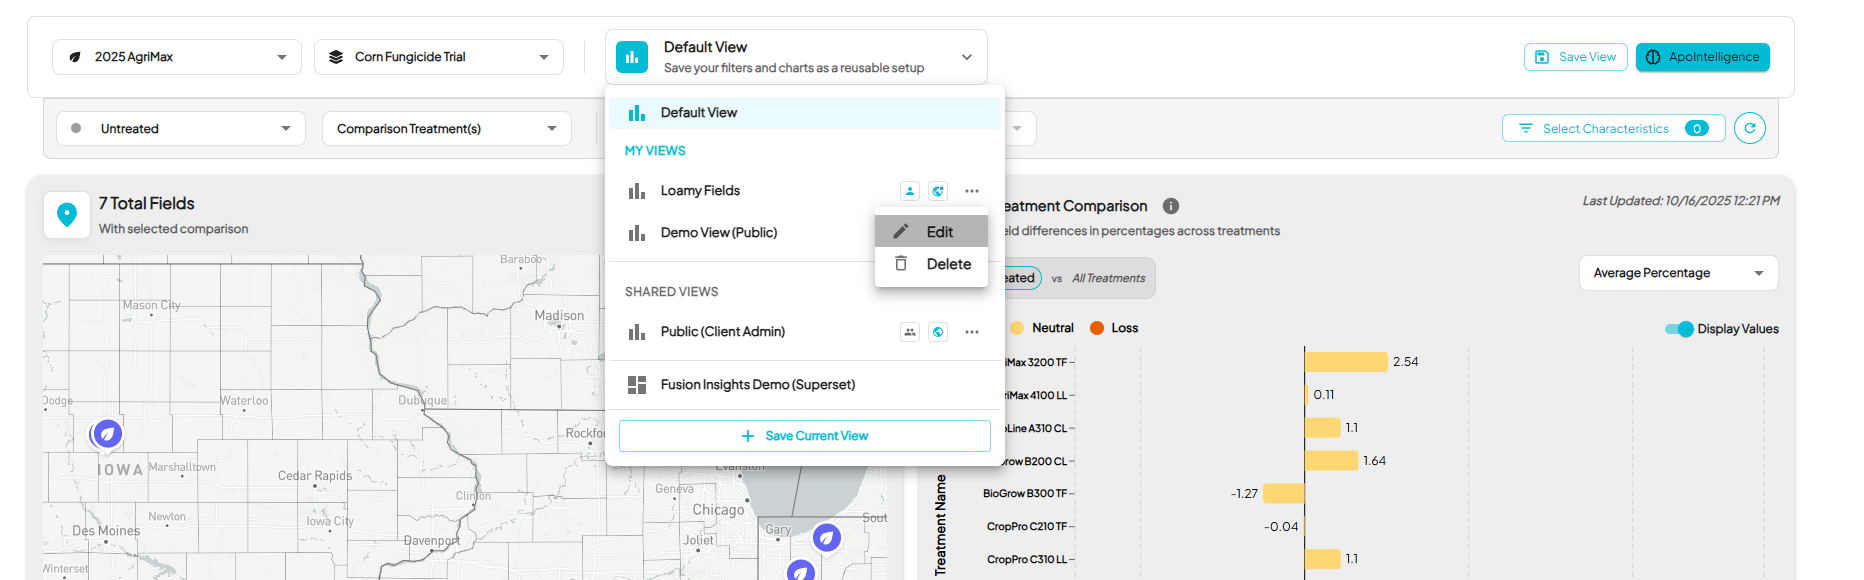
- Open the view you want to update.
- Adjust filters, treatments, or selected characteristics as needed.
- Click Save View, then select Edit Existing View.
- Confirm your changes to overwrite the previous version.
How to Switch Between Views
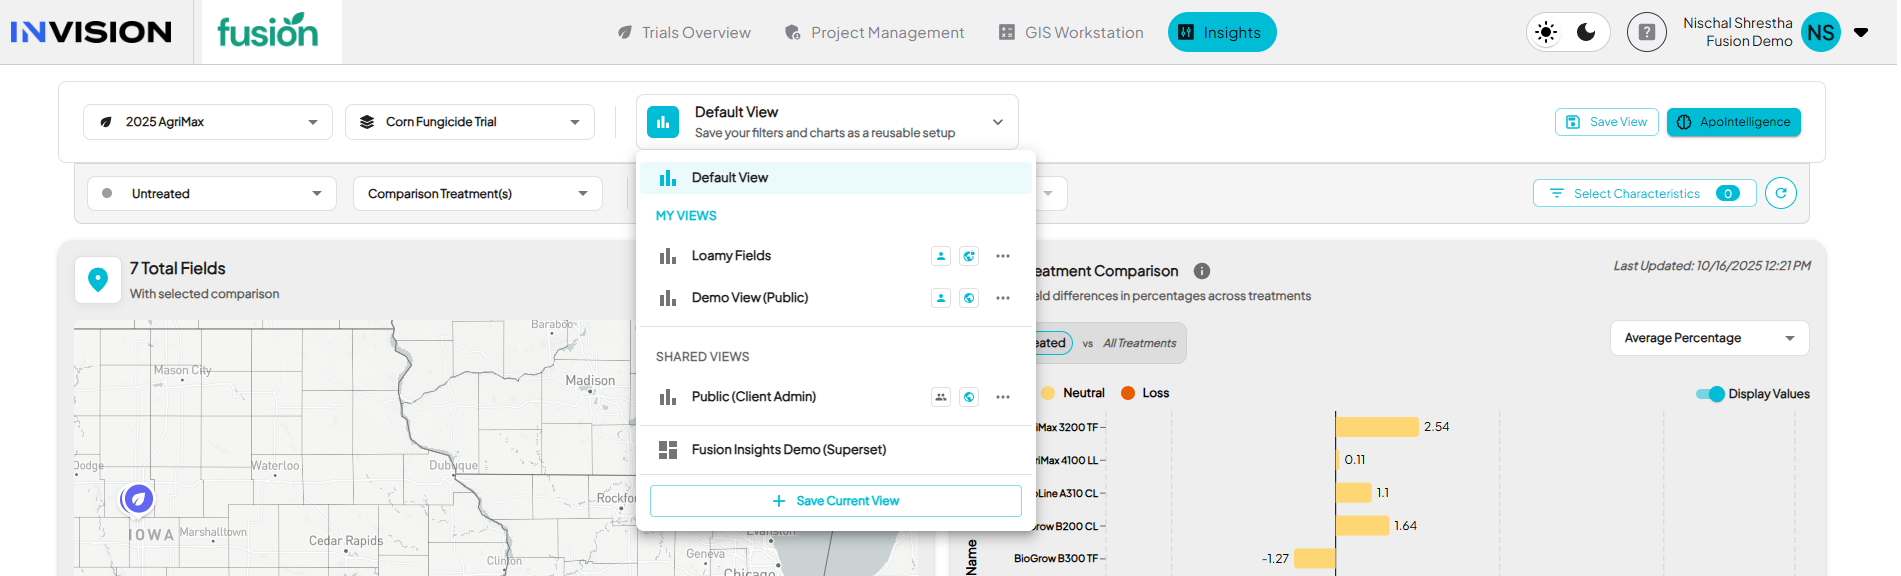
- Use the View Selector dropdown at the top to switch between your saved setups.
- Each view remembers your:
- Trial and protocol context
- Selected characteristics and filters
- Primary and comparison treatments
- Chart display preferences
Tips for Using Views
- Use Private Views for personal analysis or work in progress.
- Use Public Views for shared reporting or team-wide analysis consistency.
- Every view updates automatically when new field data or characteristics are synced into INVISION, so saved setups always reflect the latest information.
5. Understanding Public vs Private Views
When saving a view in Insights, you decide whether it’s Public or Private. This setting controls who in your organization can see and use that view.
Private Views
- A Private View is visible only to you.
- It’s ideal for personal analysis, early exploration, or in-progress setups you’re not ready to share yet.
- Any filters, characteristics, or chart configurations you create will remain private to your account.
- These are automatically stored under your profile, and you can modify or delete them anytime without affecting anyone else’s work.
Public Views
- A Public View is visible to everyone within your client organization who has access to Insights.
- It’s used for shared reporting or standardized views that multiple team members reference.
- Anyone can load and use a public view exactly as it was saved: same filters, same charts, same treatments ensuring consistent analysis across users.
- Public views can be created by any Insights user.
Putting It All Together
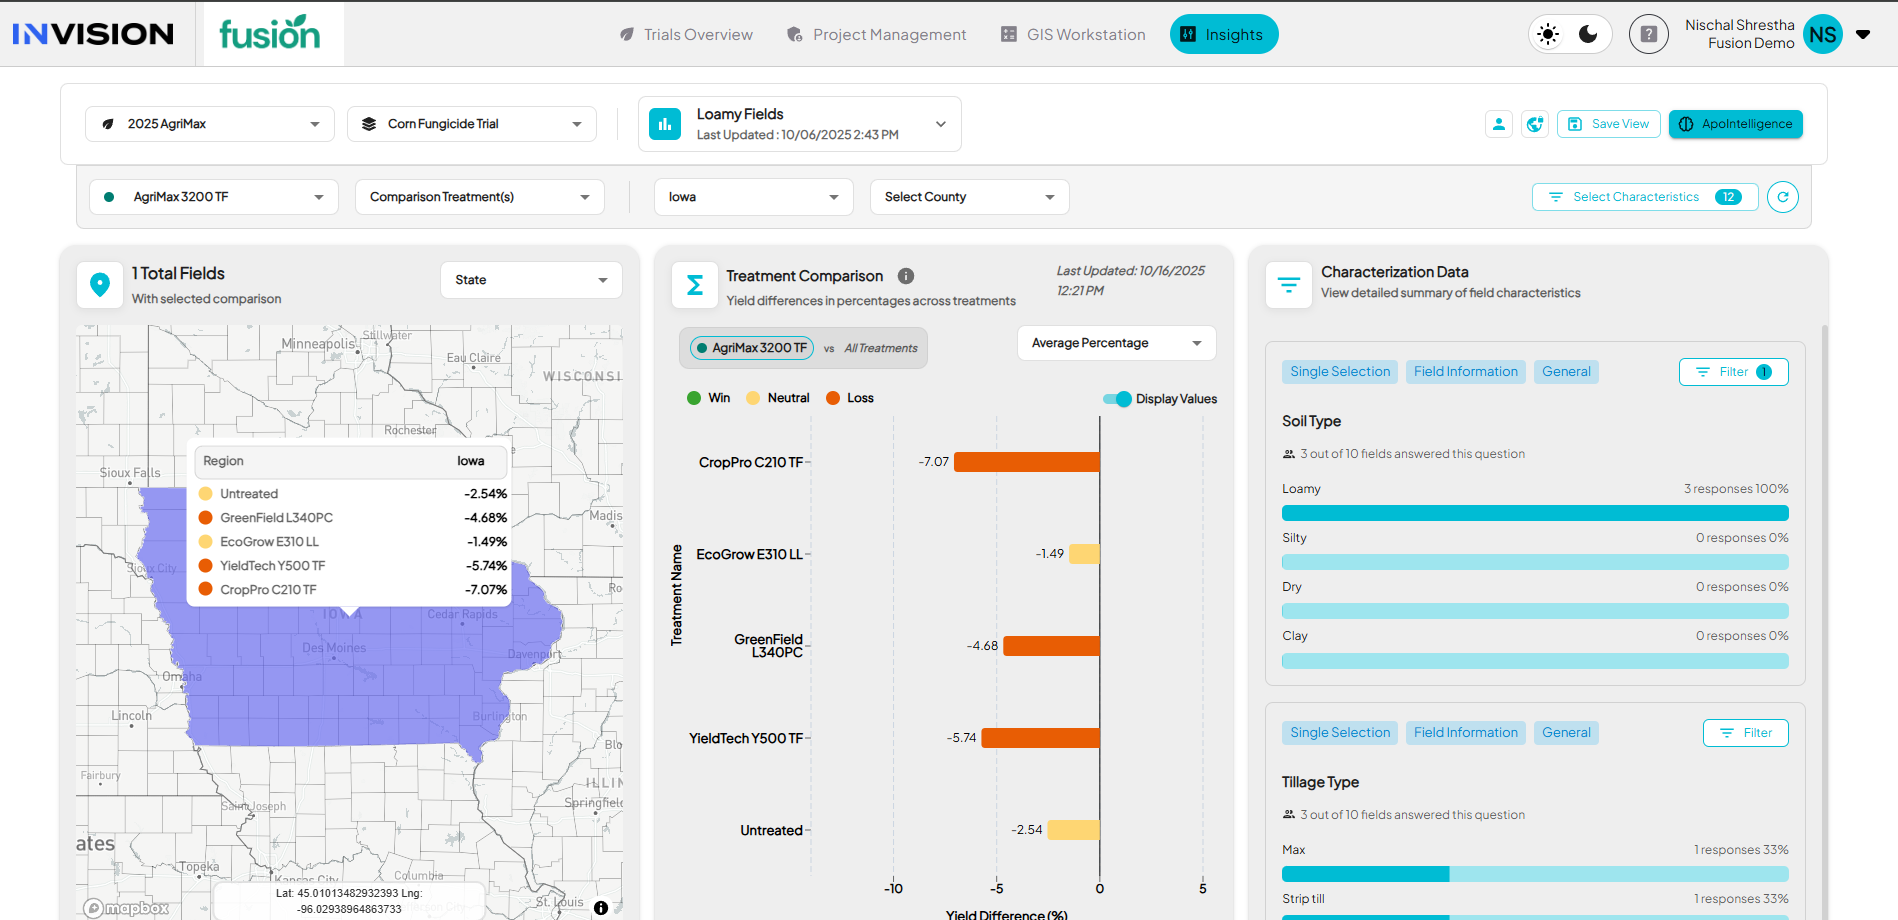
The redesigned Insights experience is built around flexibility, consistency, and speed giving every user the tools to explore and understand field data without needing a custom export or dashboard.
By combining characteristics, filters, and views, you can move from raw trial data to actionable insights in just a few clicks.
- Characteristics define what data you’re analyzing: field information, management practices, planting details, or observations collected during the season.
- Filtering lets you isolate trends, compare management systems, or see how specific variables like irrigation or soil type affect results.
- Views preserve your entire analysis setup, so you can come back to it anytime or share it with your team.
Together, they make Insights a living workspace, not just a reporting tool, where agronomy, data, and operations teams can explore patterns, validate results, and make faster, better-informed decisions.